Are We at the Threshold of a Major Rotation in Market Leadership?
It is often very easy to get caught up in what has happened in the markets and forget to look forward to the potential opportunity. Many investors have fallen back into FOMO or the Fear of Missing Out, chasing returns from the first half of the year. Fortunately, there are tools that allow us to see how market dynamics can change on a broad scale.
Originally created by Julius de Kempenaer, Relative Rotation Graphs or RRGs are a technical analysis tool that allows analysts to see how different positions are trending relative to each other, combining multiple cross sectional analysis tools into one chart. RRGs have been a favorite tool of ours for quite some time and we often reference them on our monthly market updates.
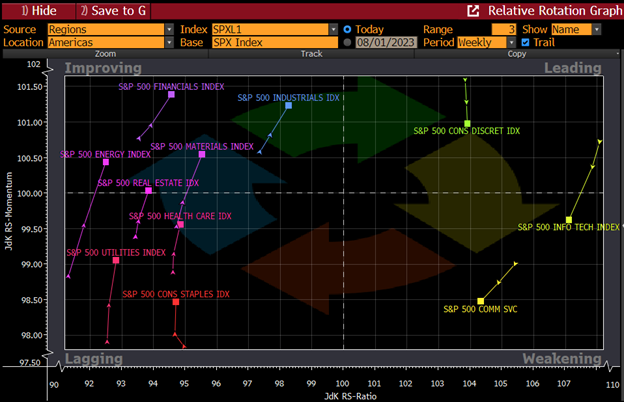
The center point of every RRG is the reference index, or in this case the S&P500 Index. Each of the colorful lines represents a sector of the S&P500, with each dot representing each sequential week. In practice, we can pair any reference index with any list of securities to observe how these securities are moving on a relative basis. Positions tend to move clockwise on the chart through the four quadrants.
Top Left = Improving
Top Right = Leading
Bottom Right = Weakening
Bottom Left = Lagging
Each sector has a tail, which is the colorful line behind the largest dot, and illustrates how many past data points we are tracking. In this case, we are observing the trailing 3 weeks of data. Subsequently, the tail shows 3 data points. Shorter tails will show less data points, while longer tails will show more data points. These tails can tell us the direction that the sectors are moving and where they have moved from.
It is interesting to note how only 3 of the 11 sectors of the S&P500 Index are on the right side of this RRG. Of those, only the Consumer Discretionary sector remains in the leading quadrant, with both Communication Services and Information Technology moving into the weakening quadrant.
Simultaneously, the other 8 sectors of the S&P500 Index are rising into or towards the upper left or improving quadrant. The Financial and Energy sectors are leading the rise as they are furthest from the center of the chart, indicating a larger move in relative performance than the sectors that are closer to the center point of the RRG.
This RRG suggests that there may be a shift in market preferences underway, from tech leadership into the lagging sectors of the S&P500 Index. This theme builds on our post from August 1st when we cited the extreme overbought conditions present in tech heavy indices that make a case to rotate into more broadly diversified positions.
As always, we will stay disciplined, filter out the noise, and allow prices to lead.
