Beyond the Inauguration: Inflation and the Real Market Story This Week
As a "new" president takes office and inflation hits 2.9%, markets face a pivotal moment. Are we headed for a breakout or a breakdown?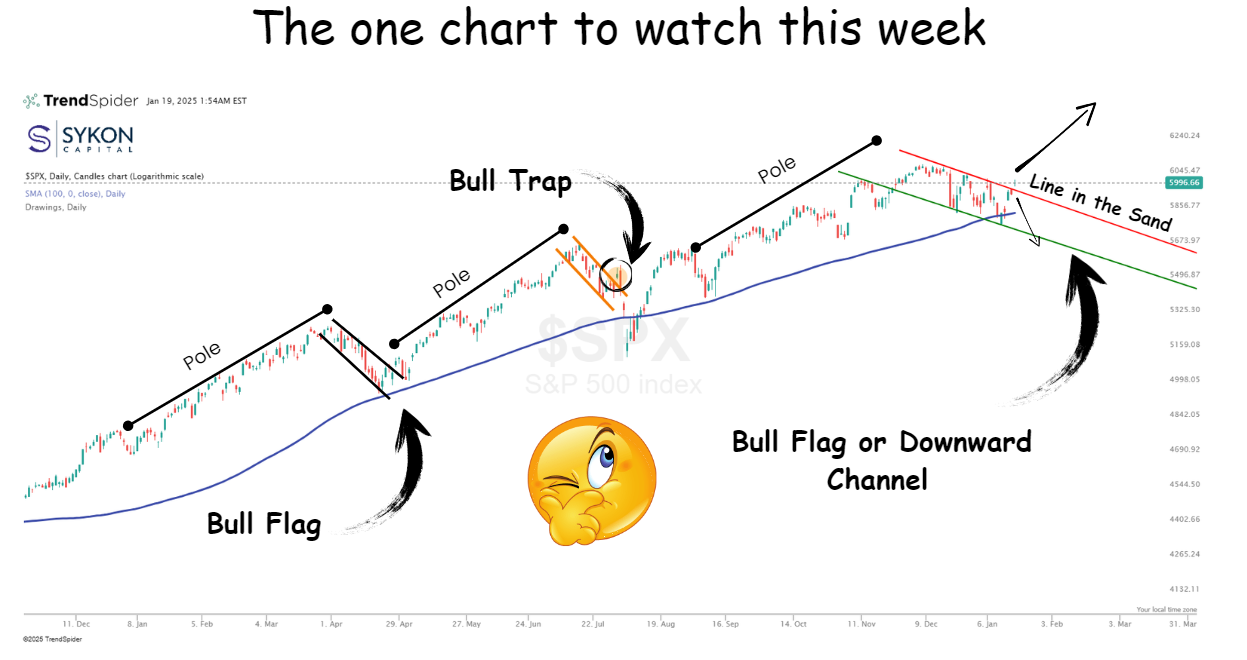
As markets digest the latest inflation data, another chapter begins in Washington. On Monday, the nation will witness the swearing-in of a “new” president, fueling speculation about how upcoming policies may shape the economic landscape. While political shifts often dominate headlines, it’s crucial to stay focused on the data.
Inflation data for December 2024 landed exactly at 2.9%, sparking a wave of optimism across the markets. While this number hit expectations, a closer look reveals we were just a rounding error away from a higher CPI print. This subtle detail has fueled debate: is the market truly on stable footing, or are we poised for another shake-up?
Breaking Down the Scenarios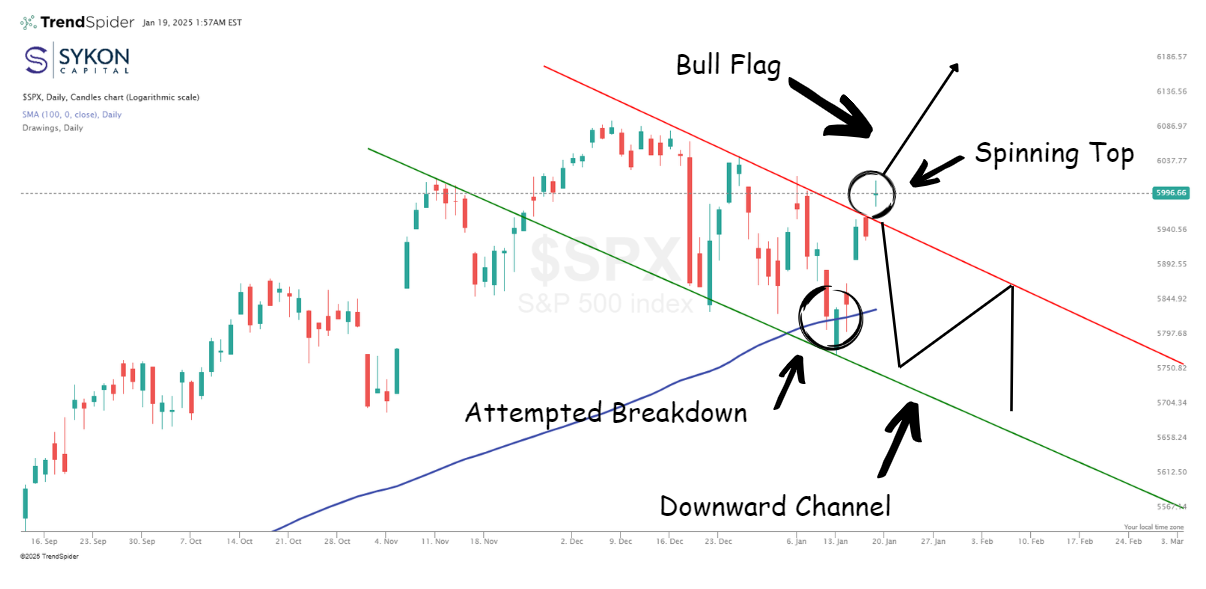
Bull Flag Scenario
A bull flag pattern is a continuation pattern in technical analysis, often indicating a further upward move in prices. It resembles a flag on a pole, where the flag represents a period of consolidation after a strong upward move (the pole). If this is indeed a bull flag, the S&P 500 will hold the recent break out above the red resistance line. This is similar to what we saw happen back in April of 2024.
In a bull flag, the measured move is calculated by adding the length of the flagpole to the breakout level. In this case, the flagpole measures 475 points, suggesting a potential move to approximately 6,400 on the S&P 500. This represents a level that is 7.9% above Friday’s close at 5996.66.
Downtrend Scenario
On Friday, the S&P 500 Index broke above the resistance level and formed a spinning top, a candlestick pattern that often signals market indecision. This may reflect a lack of conviction among market participants regarding the market’s direction, particularly ahead of a presidential transition and a long weekend filled with uncertainty.
The next few candles will be critical in determining whether this marks the start of a breakout or a reversal, as they could provide confirmation of the market's true direction.
A reversal back through this resistance would likely push the S&P 500 down to the green support line within the channel. This would target a level of about 5,725, compared to 5,996.66 today, a decline of roughly 4.5%. This is similar to the bull trap and false break out that the market experienced in July of 2024.
On January 13, the S&P 500 gaped lower but managed to recover intraday and close just above the 100-day moving average. This suggests the uptrend remains intact for now. However, if we move lower from here, it increases the probability of the index breaking below the 100-day moving average, potentially confirming that the downtrend channel is in play.
Key Takeaways
- Wait for Confirmation: Be cautious and resist the urge to anticipate the next move. While this approach carries the risk of missing the initial follow through, it also helps you avoid unnecessary exposure to downside risk.
- Opportunities Remain: Once the direction of the index becomes clearer, there will likely still be plenty of opportunity to capitalize on the upside.
- Patience Creates can help Favorable Outcomes: Exercising patience in this environment can create a more favorable risk-reward profile for your investments.
Stay Updated
Markets are at a critical juncture, and staying informed is essential. Subscribe to my weekly insights to ensure you never miss a potential opportunity. For a deeper dive into this analysis or to discuss how it impacts your portfolio, don’t hesitate to reach out and register for our 2025 Market Outlook Webinar on January 23, 2025 at 11:30am ET.
Register for the upcoming Market Outlook Webinar
