Caution Ahead: A Critical Analysis of Current Stock Market Trends and Investor Sentiment
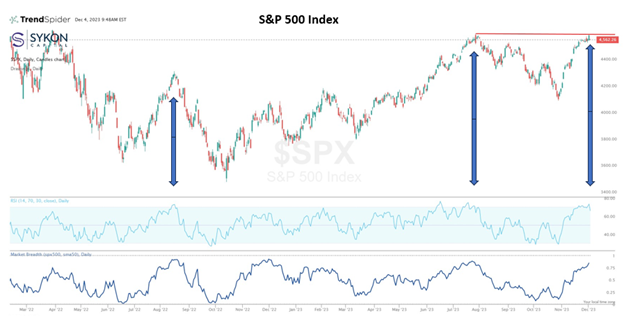
After coming off one of the best months in the history of the stock market this past November, I believe we have reason to be cautious. As we look at the S&P 500, we can see that it's encountering overhead resistance around the 4600 level. This coincides with the previous peak we saw in early August.
In addition to this overhead resistance, we're observing extreme overbought conditions. Below this chart, there are two indicators to note: the Relative Strength Index and the market breadth, specifically the percentage of stocks above their 50-day moving average. Over the last two years, there have been three instances where we saw similar conditions - an overbought RSI and more than 85% of stocks above their 50-day moving average. On both previous occasions, these conditions led to significant pullbacks in the market, and we're now seeing a similar setup.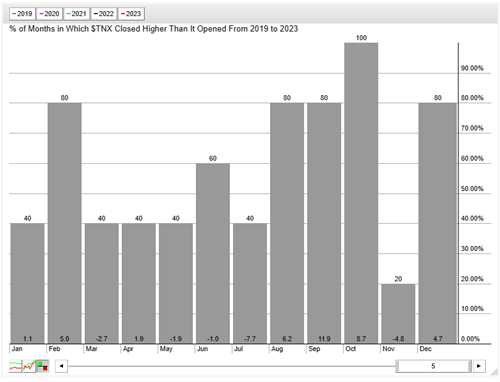
Source: StockCharts.com
The Equity markets are cheering the decline in interest rates, especially in longer duration bonds. According to the seasonality chart, 10 year treasury yields have declined 80% of the time in November. But come December paints a different picture. Historically, the 10-year Treasury yield has been higher in December 80% of the time over the last 5 years. This leaves only 20% when it hasn't been. Given the strong correlation we've observed between interest rates and the equity markets, this is another reason for caution.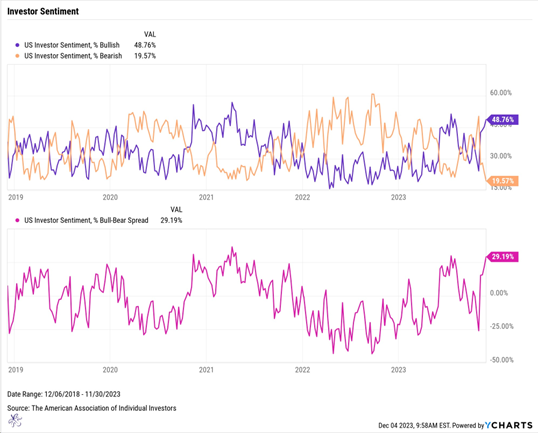
The reality is that people may have become overly optimistic, too quickly. When you combine this with the current extreme optimism in the market, there's more reason to be hesitant at these levels. The most recent AI investor sentiment shows a bullish reading of 48.76% and a bearish reading of 19.57%. This spread of 29.19% is considerable, and I generally consider anything over 20% to be extreme. This indicator often serves as a contrarian index, which further supports our reasons for caution.
So, while we're not suggesting this is the end of the rally, we do believe that patience might reveal better opportunities to find levels for more attractive positioning. In short, stay patient and flexible.
Let the prices lead and the fundamentals follow.
