Fed Rate Cuts: Be Careful What You Wish For
By Todd Stankiewicz | CIO, SYKON Capital | Portfolio Manager, Free Markets ETF (FMKT)
Friday’s inflation report showed CPI rising 3.0% annually, below the expected 3.1%, sparking a market rally as investors celebrated the likelihood of continued Federal Reserve rate cuts (U.S. BLS). Markets are now pricing in near-certainty that the Fed will cut rates by 25 basis points at this week’s October 28-29 meeting (Investopedia).
But this enthusiasm may be misplaced. History offers a sobering reminder: Fed rate-cutting cycles are rarely cause for celebration.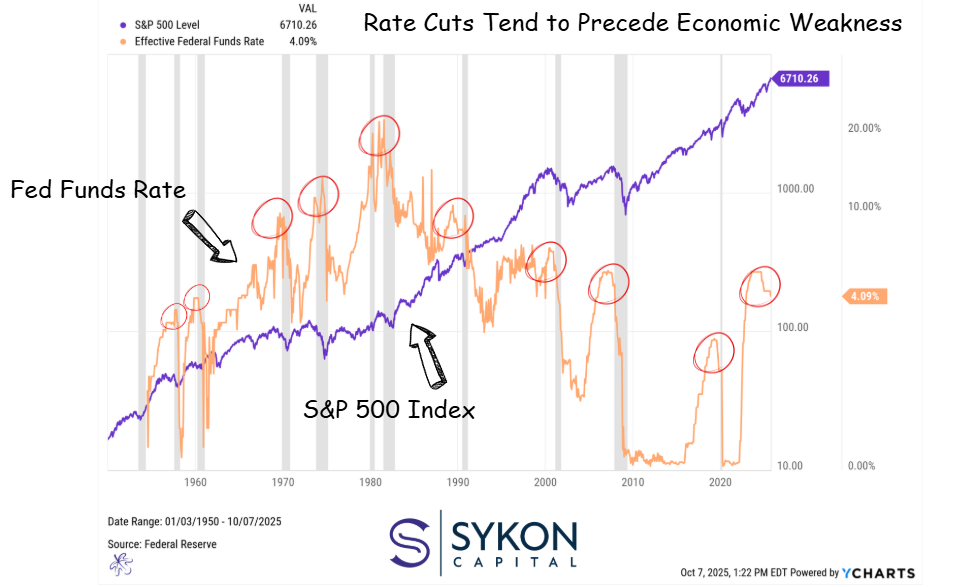
The chart of Fed rate cuts overlaid with recession periods (marked in grey) tells a compelling story. Most rate-cutting cycles don’t occur because the economy is robust and expanding, they happen because the Federal Reserve is responding to emerging cracks in economic foundations. Rate cuts typically precede or accompany economic weakness, often followed by the market volatility that characterizes recessionary environments.
This pattern makes intuitive sense. The Fed doesn’t slash rates when everything is going well. They cut rates when the labor market softens, when growth slows, or when financial conditions tighten enough to threaten economic stability. Fed officials have explicitly stated they’re cutting rates due to concerns about weakness in the labor market, not because inflation has been fully conquered (Investopedia).
Current conditions echo this historical pattern. While inflation has moderated from its peaks, it remains above the Fed’s 2% target. Meanwhile, job growth has decelerated sharply, and unemployment insurance claims are rising. The Fed finds itself in the uncomfortable position of cutting rates not from strength, but from necessity.
S&P 500 Key Levels
The S&P 500 will be closely watched this week as markets digest the Fed’s rate decision and respond to Friday’s encouraging inflation data. While the index continues riding the upper Bollinger Band, typically a sign of healthy momentum and a strong rally, troubling technical signals are emerging beneath the surface.
The most concerning development is a bearish divergence in the Relative Strength Index (RSI). On Friday, the S&P 500 made a new price high, but the RSI failed to confirm with a corresponding new high. This divergence often precedes corrections, as it suggests weakening momentum despite rising prices. Additionally, RSI readings are approaching overbought territory, further increasing the probability of a near-term pullback.
If a correction materializes, there are two key support levels to monitor. The first target would be the middle Bollinger Band around 6,422 (based on Friday’s close), representing approximately a 370-point decline or about 5% from current levels. This would constitute a normal, healthy pullback within an ongoing uptrend.
However, if selling pressure intensifies and the index breaks below the middle Bollinger Band, the next logical target becomes the lower Bollinger Band near 5,597. This scenario would represent an approximately 800-point decline, roughly 12% from current levels.
For investors, this context matters enormously. Rather than viewing rate cuts as an unambiguous positive, consider what they signal about underlying economic health. Consider positioning portfolios respectively, maintain adequate cash reserves, and prepare for potential volatility ahead.
I’ve said it before and I’ll say it again: be careful what you wish for.
The key for investors is proper risk management; take profits when appropriate, maintain disciplined position sizing, and ensure your portfolio can withstand normal market volatility without forcing emotional decisions.
