Is the unwind of the YEN carry trade the reason for the market Volatility?
In the past month we have seen a massive sell off in the US Dollar to Japanese Yen currency. The unwind of this carry trade is potentially causing a deleveraging of risk assets.
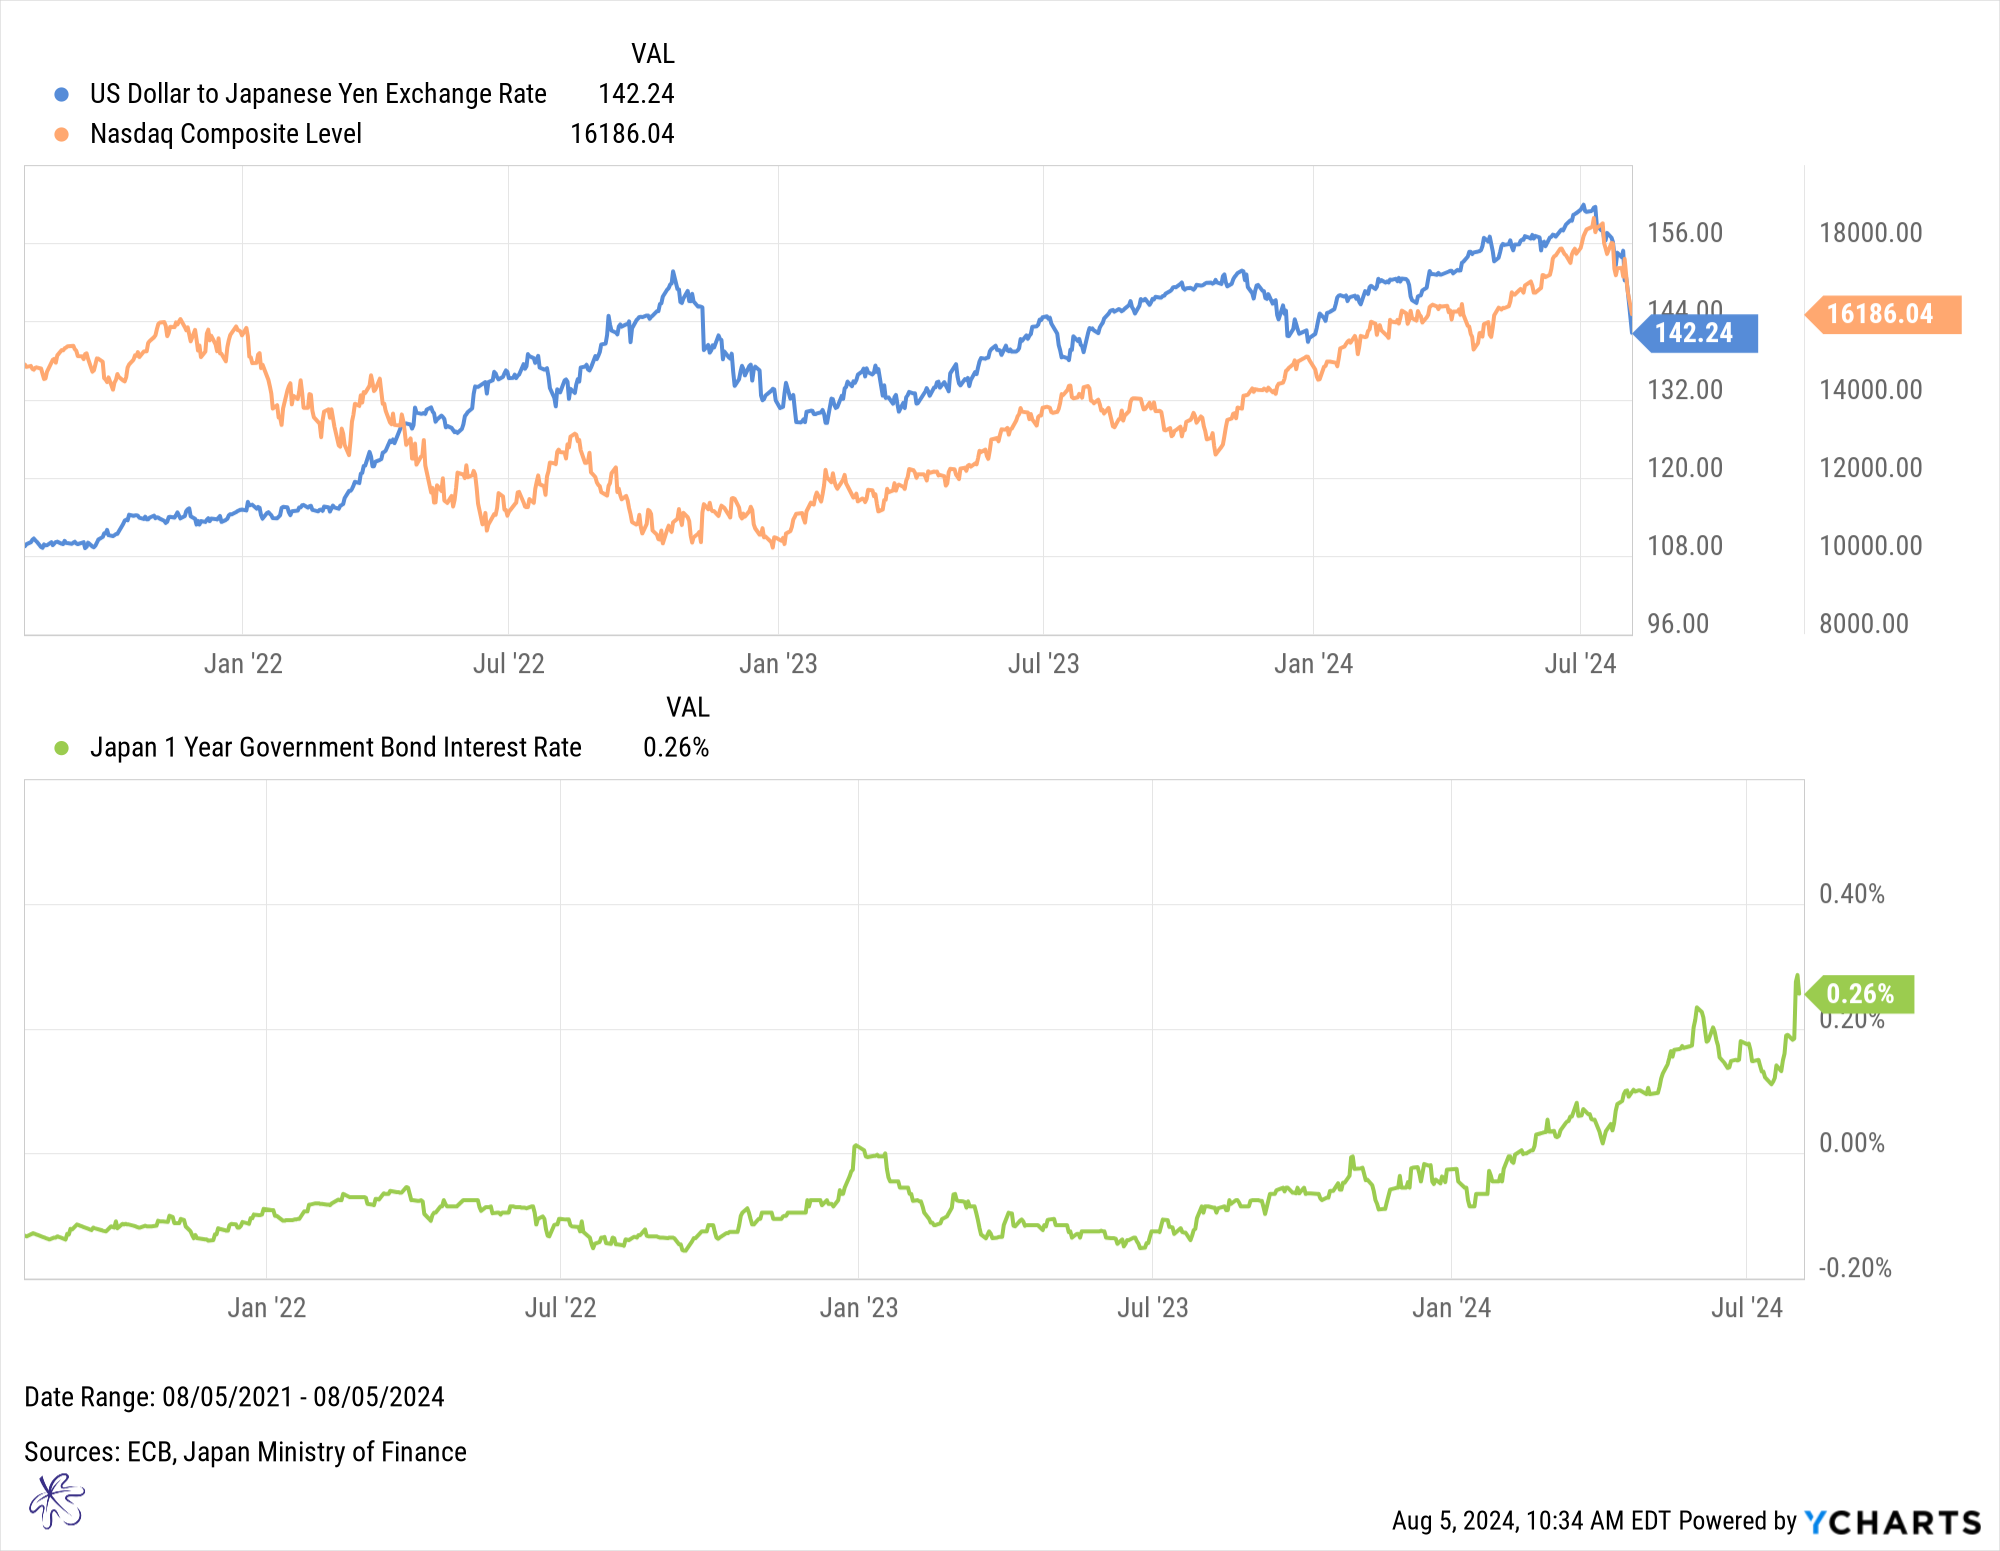
Over the last year, short term rates in Japan spiked from yields of -0.15% in July of 2023 to 0.26% in July of 2024. This can be seen in the green line above. On March 19, 2024, the Bank of Japan hiked interest rates for the first time in 17 years. This ended the long-standing policy of negative interest rates, accelerating the spike in short term yields.
This means that if you are an institution borrowing in Yen, you went from being paid interest to borrow, to having to pay interest to borrow. This is a significant increase in your cost of capital. As a result of this, the USD to Yen exchange rate has spiked to multiyear highs, peaking at 161.58 on July 11. This is indicated by the blue line above. Since this time, the currency rate has rapidly sold off and reversed. This indicated that the carry trade is reversing as people sell USD to buy Yen and potentially unwind leverage.
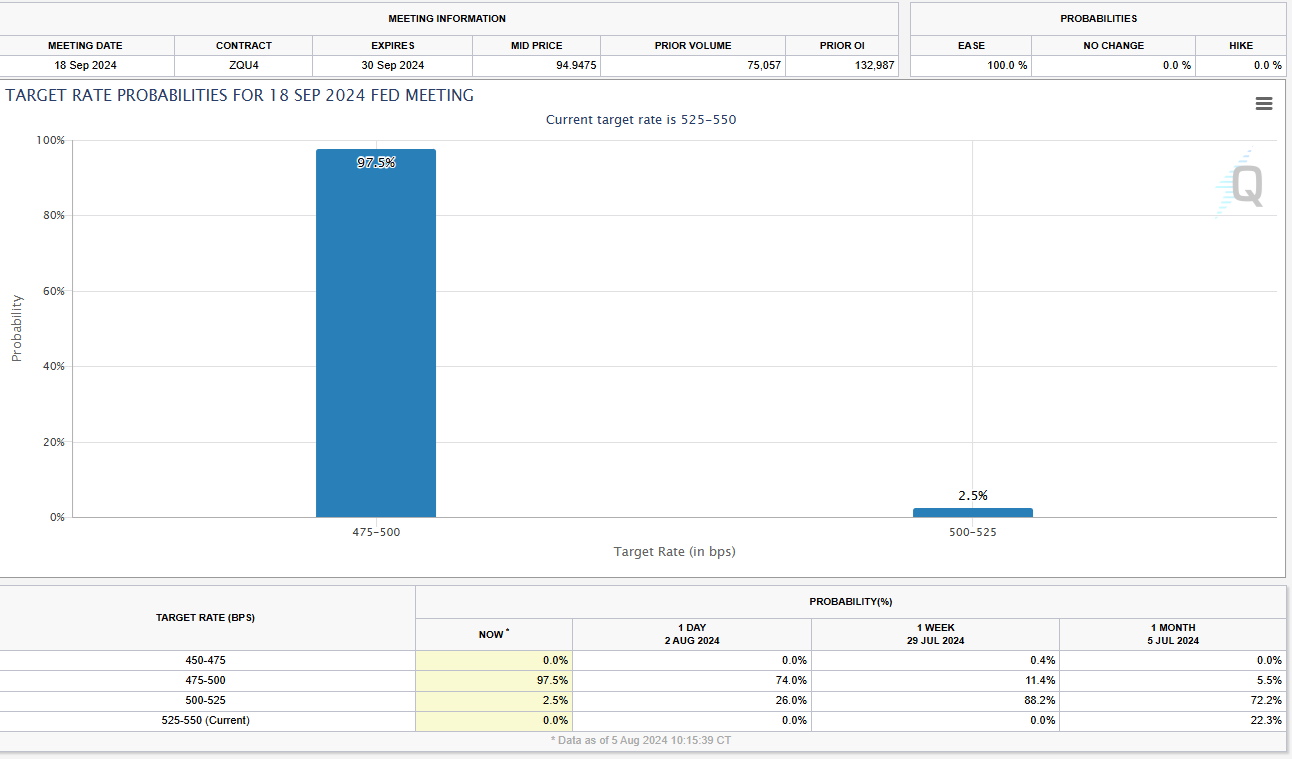
Source: CME FedWatch Tool
The emergence of last week’s data further increased the probability that the FOMC will not cut by just 25 bps in September, as there is now a 97% probability that the FOMC cuts by 50 bps. In one week, this probability increased from 11% to 97%. As the probability increases that the FOMC may cut rates in September, the potential unwind of this carry trade rises due to the narrowing of the spread between Yen rates and USD rates.
A major source of investments for these levered participants was potentially risk-based assets, such as the Nasdaq and other related Artificial Intelligence investments. Notice how the orange line on the first chart starts to sell off at the same exact time that the USD/Yen trade unwinds
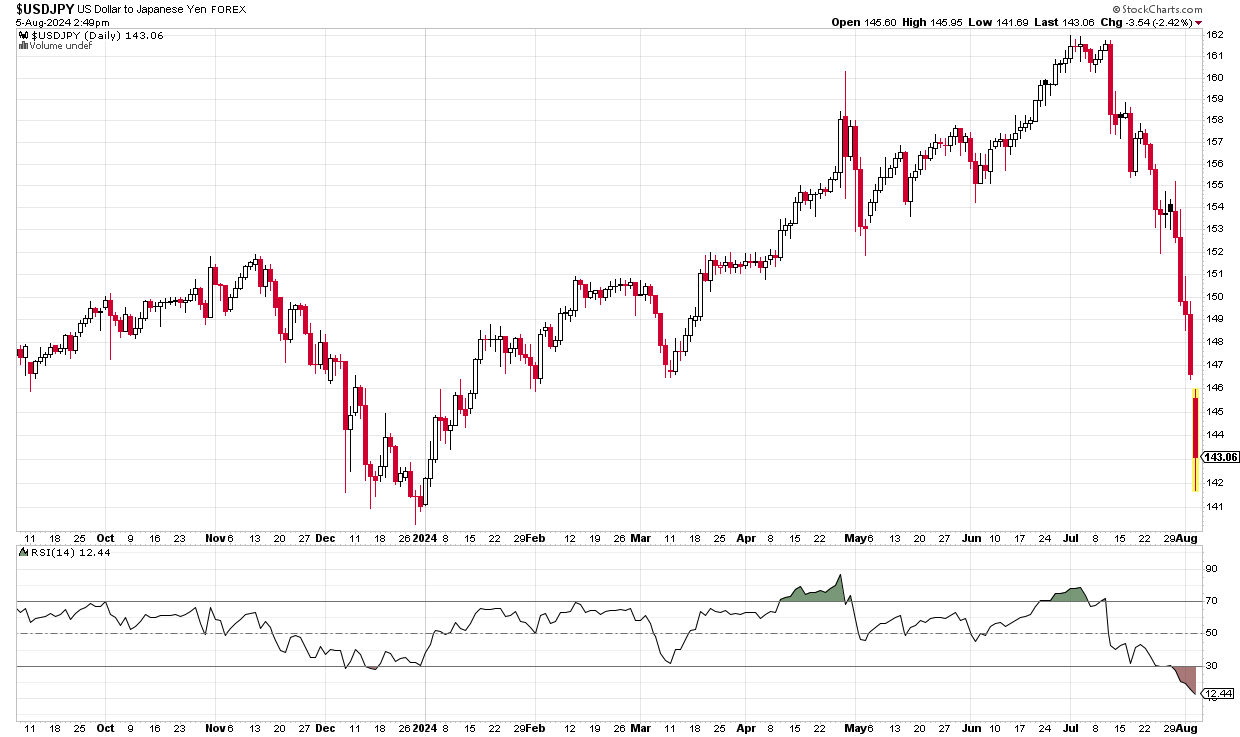
Source: StockCharts.com
Over the past few days, the market has sold off in rather extreme fashion. The result of this is that the reverse carry trade has hit oversold levels. As of 10:45am today, it is down to a level of 12.18. This is the most oversold it has been in the past two years
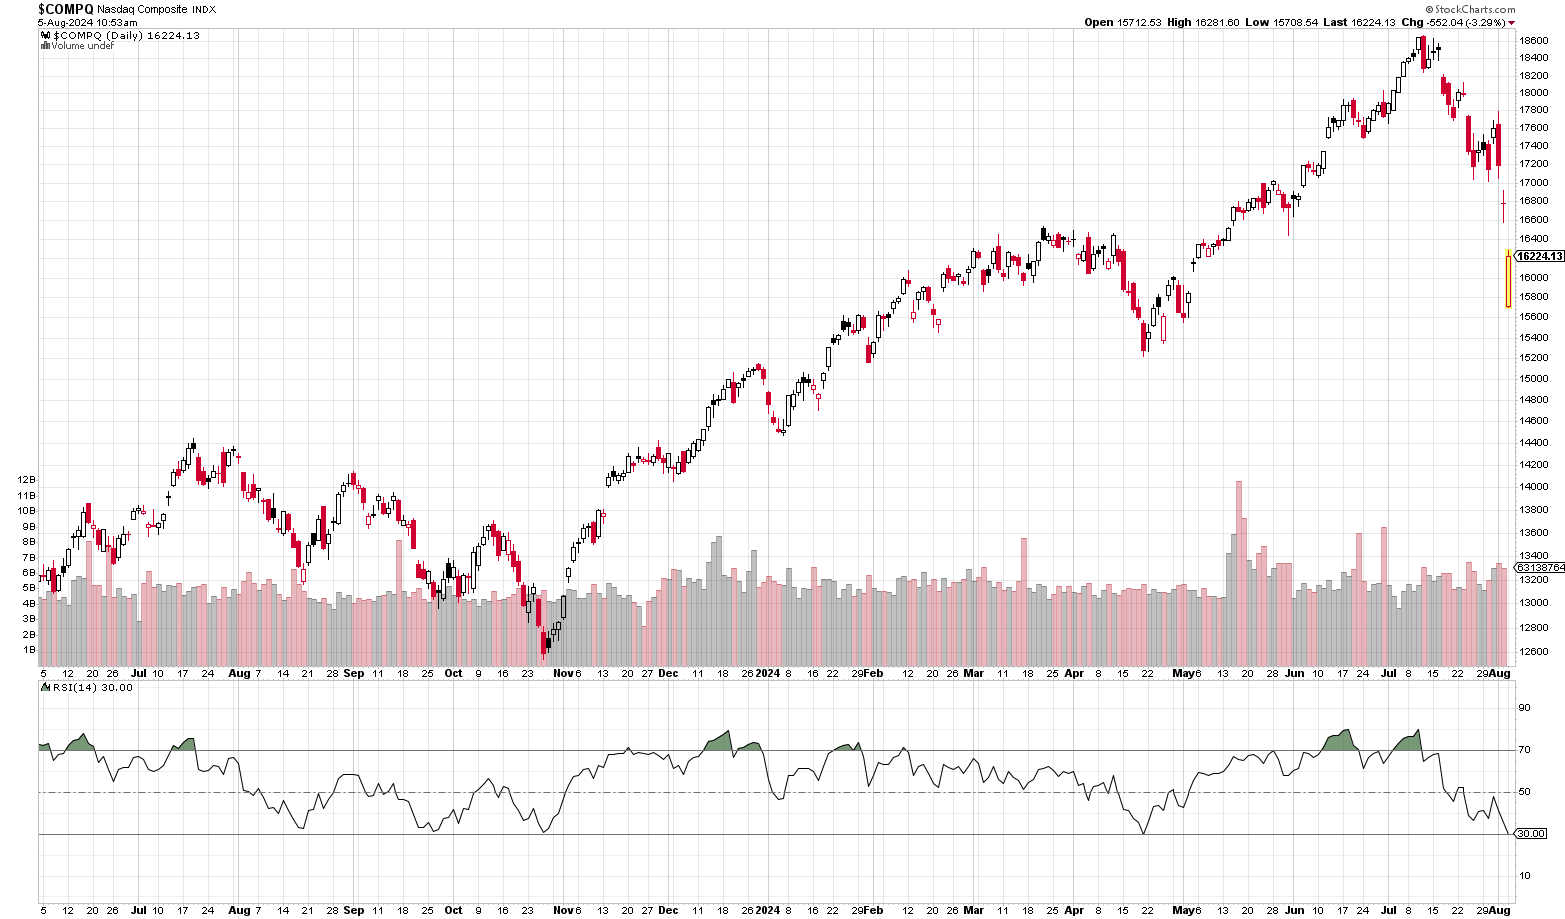
Source: StockCharts.com
The Nasdaq composite Index is also hitting a daily RSI level of 30 as of 10:55am today. This oversold reading has also been recorded on April 19, 2024, October 26, of 2023, September 27, 2023 and August 18, 2023. Each of those oversold readings was met with significant bounces.
Although, the bounces in August and September of 2023 were met with lower lows.
So, what do you do from here?
Back on June 21 we wrote about the potential for a reversal in the Semiconductor boom (Can AI Continue Driving the Semiconductor Boom? A Look at Historical Patterns) based on the extreme overbought conditions. We highlighted that the best course of action was to rebalance your portfolio at that time.
At this point, if you have portfolios held away that have not been rebalanced, today might not be the day to do this. Due to the extreme readings on the oversold conditions, there is an increased likelihood that there is a short-term tactical bounce. This could potentially create a better opportunity to reallocate.
