Is this rally exhausted?
By Todd Stankiewicz | CIO, SYKON Capital | Portfolio Manager, Free Markets ETF (FMKT)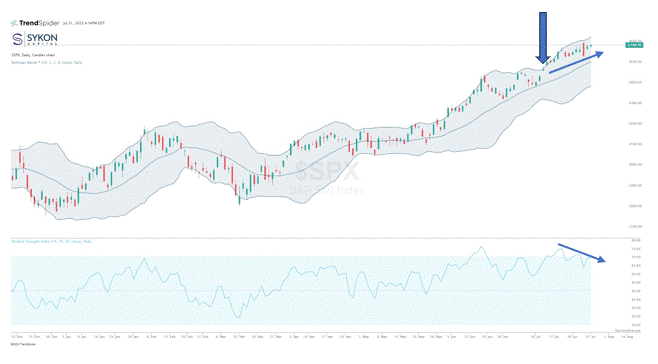
On July 12th we posted the “THE Chart to Watch” of the S&P500 index. We noted that a break above the upper Bollinger Band could lead to a more sustained rally in the S&P500 index. The close on July 12th was 4,472.16. The next day, the index broke the upper band as has ridden it to 4,588.96, where it closed yesterday on July 31st.
This rally occurred sharply, as the index climbed 116 points over two and a half weeks. As a result of this sharp rise, the index is not just looking overbought, but displaying major bearish divergences on both the daily and weekly charts.
In this daily chart, the S&P500 is making new price highs, while the relative strength index (“RSI”) is lower on each successive high. Historically, this type of divergence is likely to be accompanied by a reversal or pause in the rally.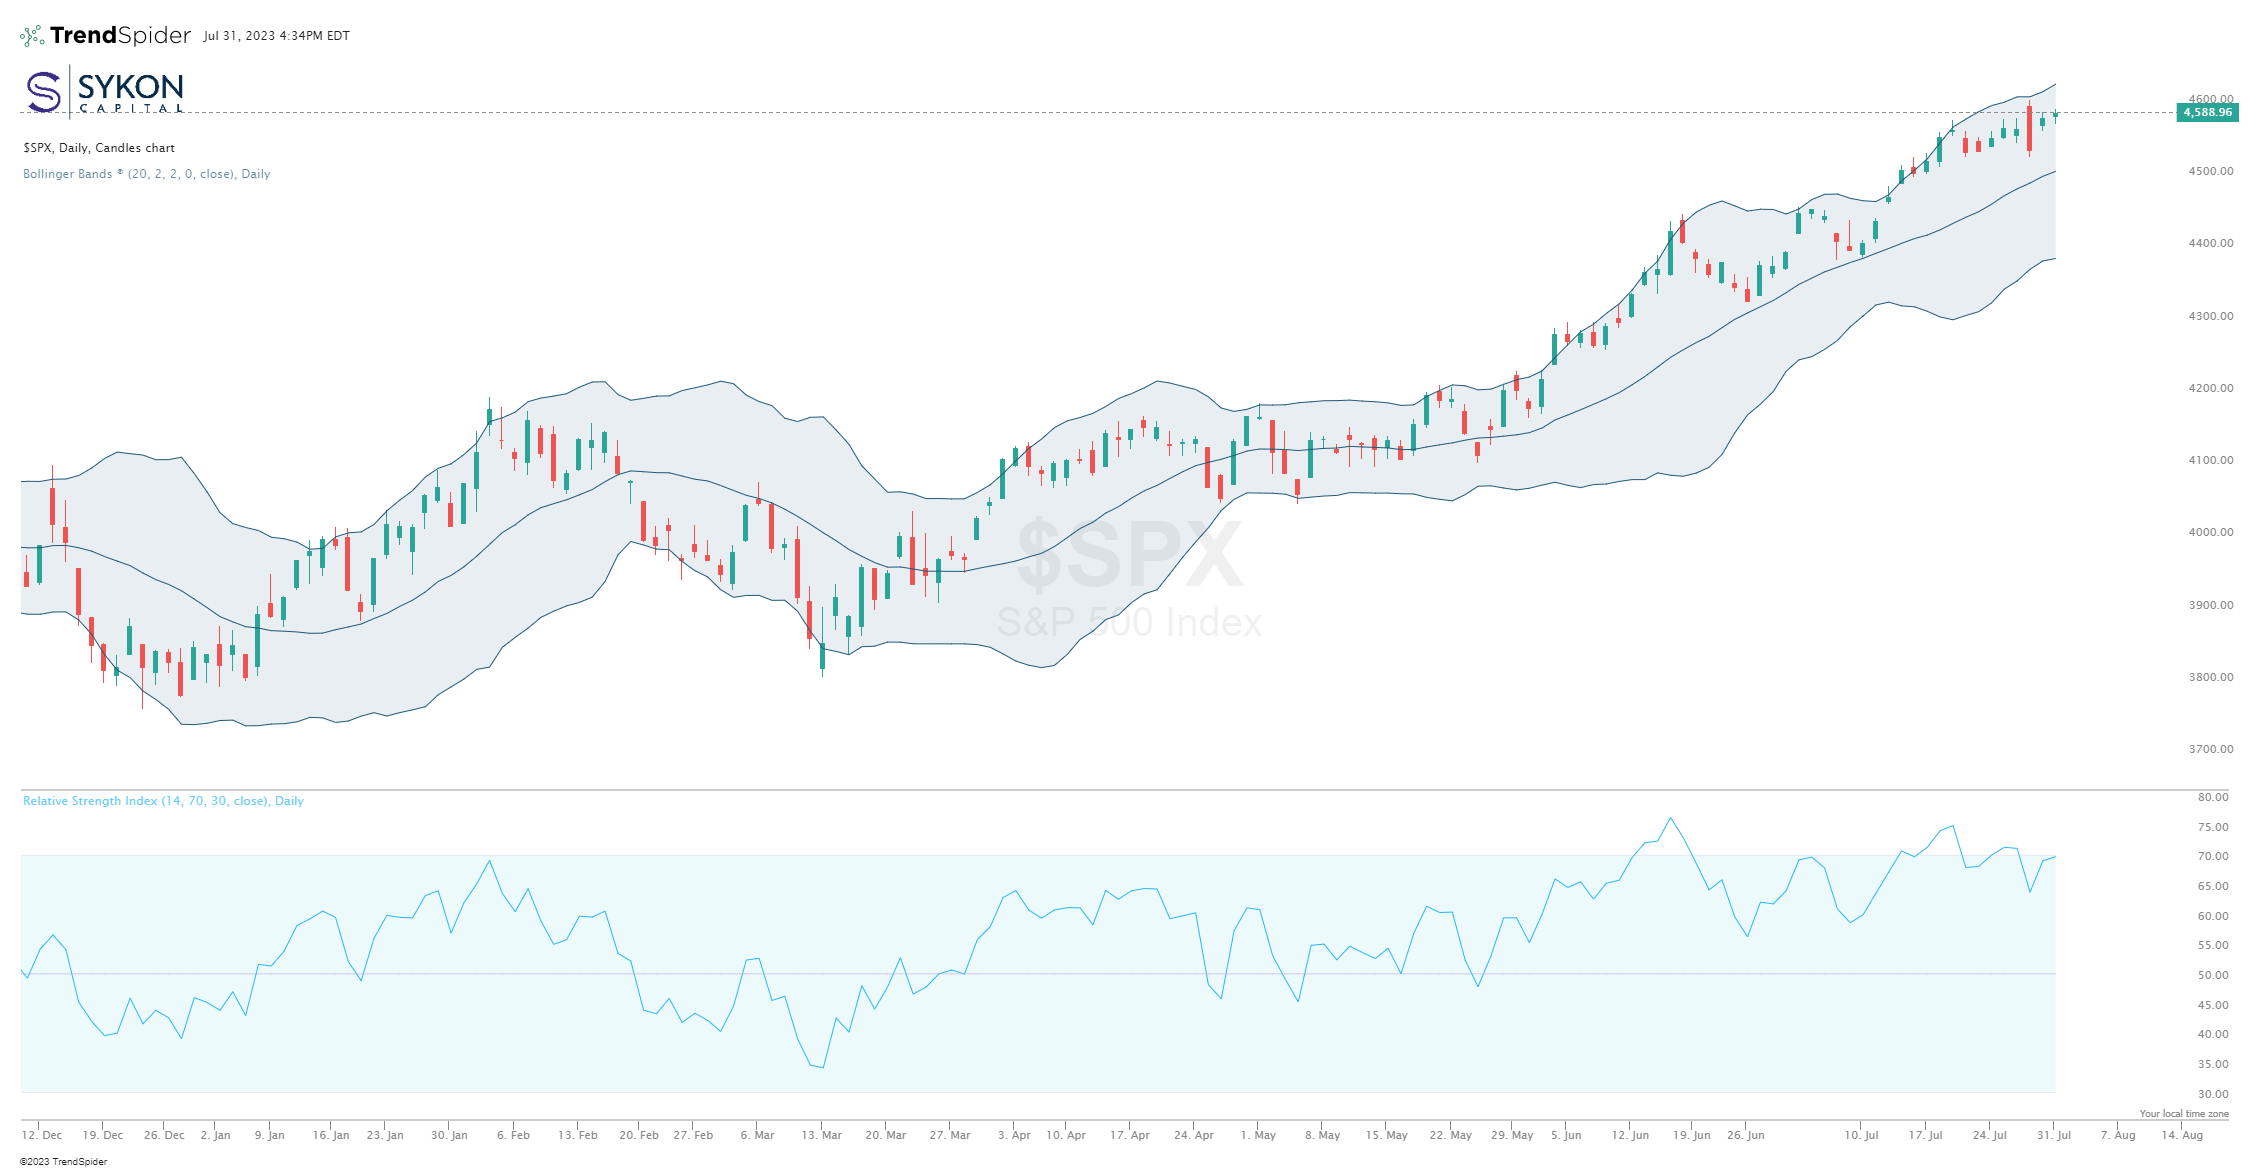
While the daily chart is displaying potential reversal patterns, the weekly chart has moved into an RSI overbought condition with last week’s close at 70.70. We are seeing similar patterns in other market cap weighted indices, such as the Nasdaq Composite, which recently closed with an RSI of 73. This reading is above the 70 level, which is considered overbought, and can be seen in the chart below.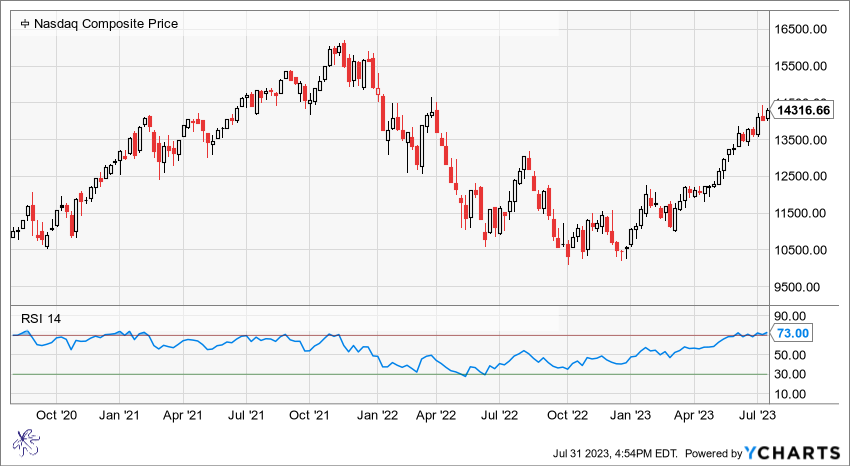
We believe there is opportunity though, specifically in indices with non-market cap orientations and more favorable RSI levels. For example, the S&500 Equal Weight Index has an RSI level of 62.22 on the weekly chart, suggesting that it is not overbought like the more market cap weighted indices.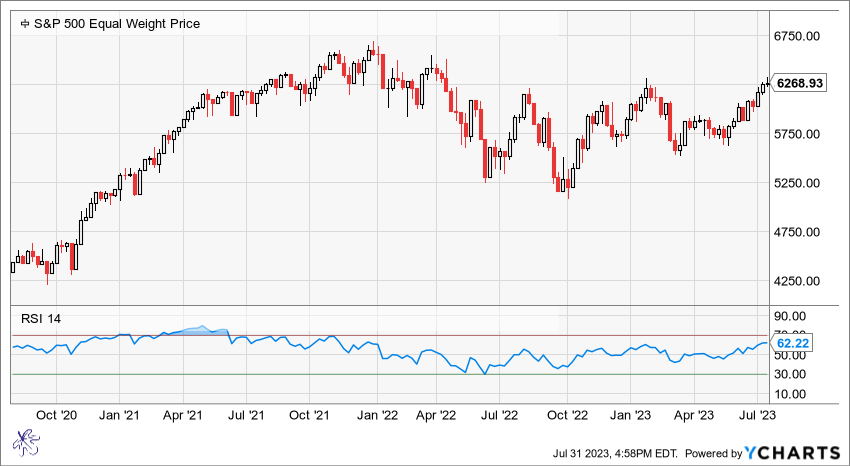
While the trends are still strong in many equity indices and individual positions that have rallied substantially, they may be over extended. This does not mean that cash is your only alternative and it may be prudent to consider diversifying into positions that have not participated as much in the rally. This may not only provide more upside potential, but it can help protect if there is a reversal or selloff.
It is important to consider that investments require consistent evaluation within your sell discipline, as we are continuously faced with the decision to buy more, hold, or sell a position. This is precisely why we utilize a disciplined, objective rules-based process. It is analyzing the data on a constant basis to aid in the evaluation of not simply whether we should or should not own a position, but if there are better opportunities to elsewhere in the market.
As always, let the prices lead and the fundamentals follow. We are not going to try to predict what is next. We will filter through the noise and listen to the signals.
