S&P500 Oversold Bounce May Not Be Enough
By Todd Stankiewicz | CIO, SYKON Capital | Portfolio Manager, Free Markets ETF (FMKT)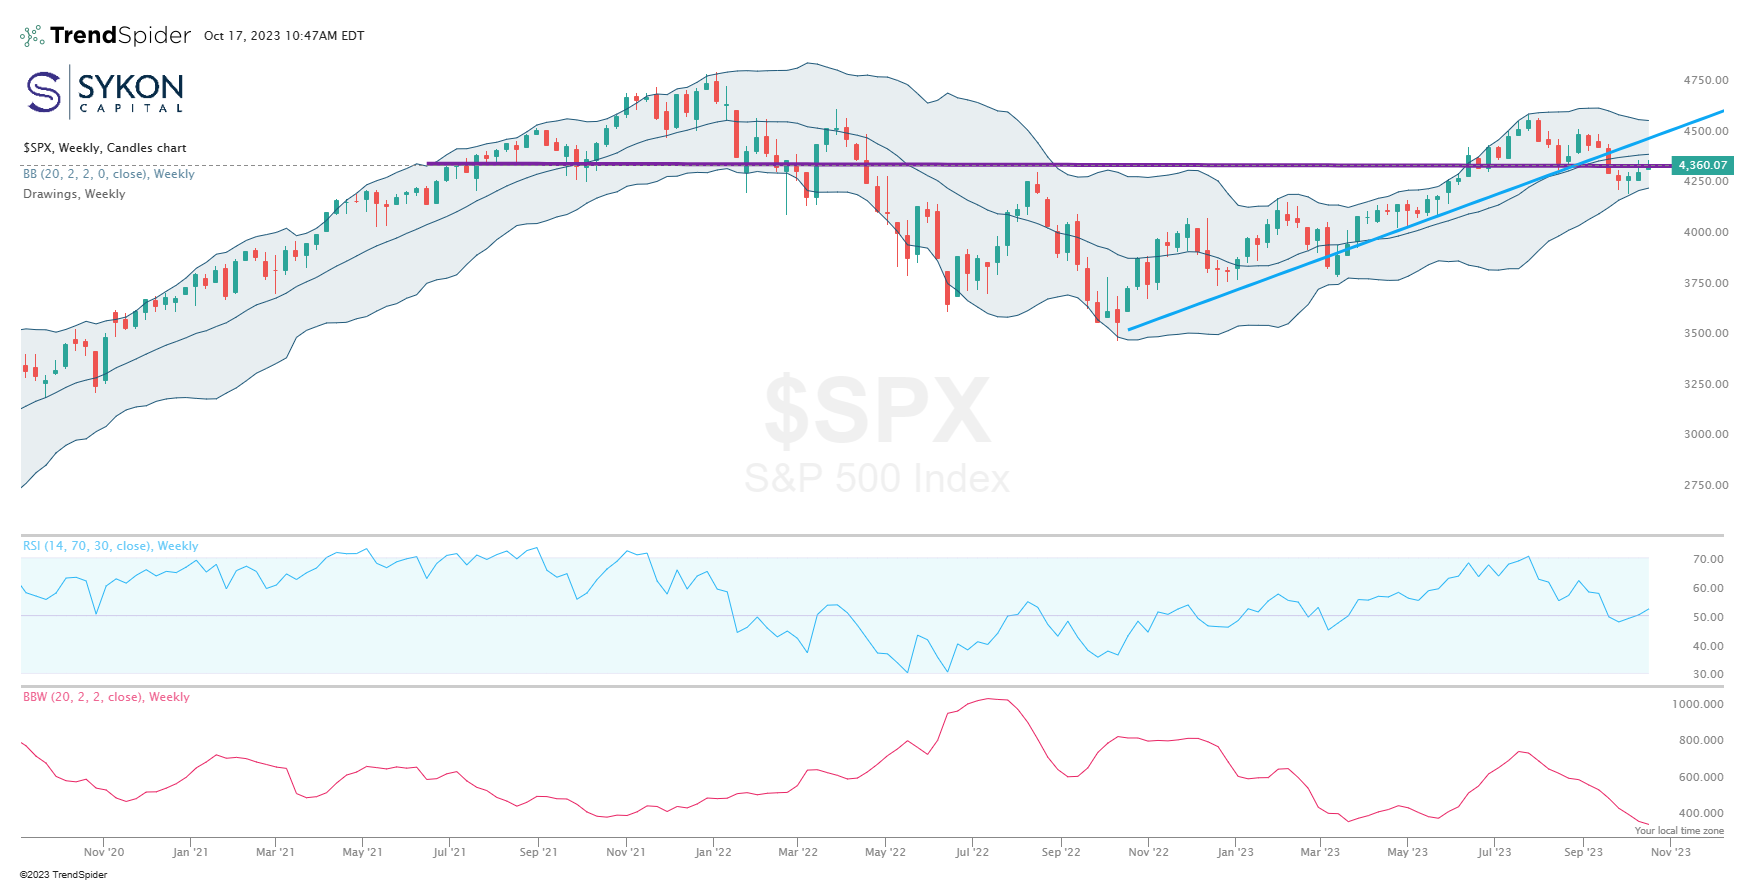
In early August, we took note of the overbought conditions in the market, which heightened the possibility of a reversal. As the market did reverse, it found support later in August at the middle Bollinger Band, coinciding with support at the blue uptrend line. Unfortunately, the rally turned out to be short-lived, with market participants fading the bounce, ultimately pushing the S&P500 Index below both the blue uptrend support line and the middle Bollinger Band on the Weekly Charts.
In a recent post, we discussed how the break of the middle Bollinger Band might lead the index towards the lower Bollinger Band support, which indeed happened on October 3rd. Subsequently, the index entered oversold territory with a daily RSI reading of 28.66.
However, it's worth noting that the current rally may not have the strength to breach key resistance levels. The purple resistance line has been a significant point of congestion for the index since May 2021. Even if a breakout occurs, the middle Bollinger Band could pose additional resistance.
Our focus now is on key levels that will provide guidance. We will monitor how the S&P500 index reacts at these resistance and support levels. A move above the middle band at 4413.75 would bring the upper band into play at 4580.60. Conversely, a failure at these levels could rekindle the possibility of the lower band coming into play at 4247.14.
What's intriguing is the increased likelihood of the Bollinger Bands widening in the near future. The Bollinger Band width indicator at the bottom of the chart demonstrates how it tends to oscillate from narrow to wide and then reverses. We observed a similar pattern in the Fall of 2021 and again in Spring 2023. In both instances, the Bollinger Band width expanded, leading to significant market movements. In the Fall of 2021 the Bollinger band width expansion was accompanied by a move lower in the index. While the Spring of 2023 saw a width expansion followed by an upside break.
Considering this similarity, there's a strong probability of an outsized market move looming. The key lies in which Bollinger band the Index breaks. If it breaks the upper band, it's likely to ride higher, while a break in the lower band suggests a higher probability of it moving lower.
In times like these, patience is paramount. Watch these crucial levels closely and respond accordingly. Attempting to predict the market can be precarious, which underscores why our strategies remain dynamic, adapting to changes in the market environment.
