S&P500 Rising Wedge and bearish RSI Divergence
As the S&P500 index forms a rising wedge, can the RSI provide even more context as to what the next move may be.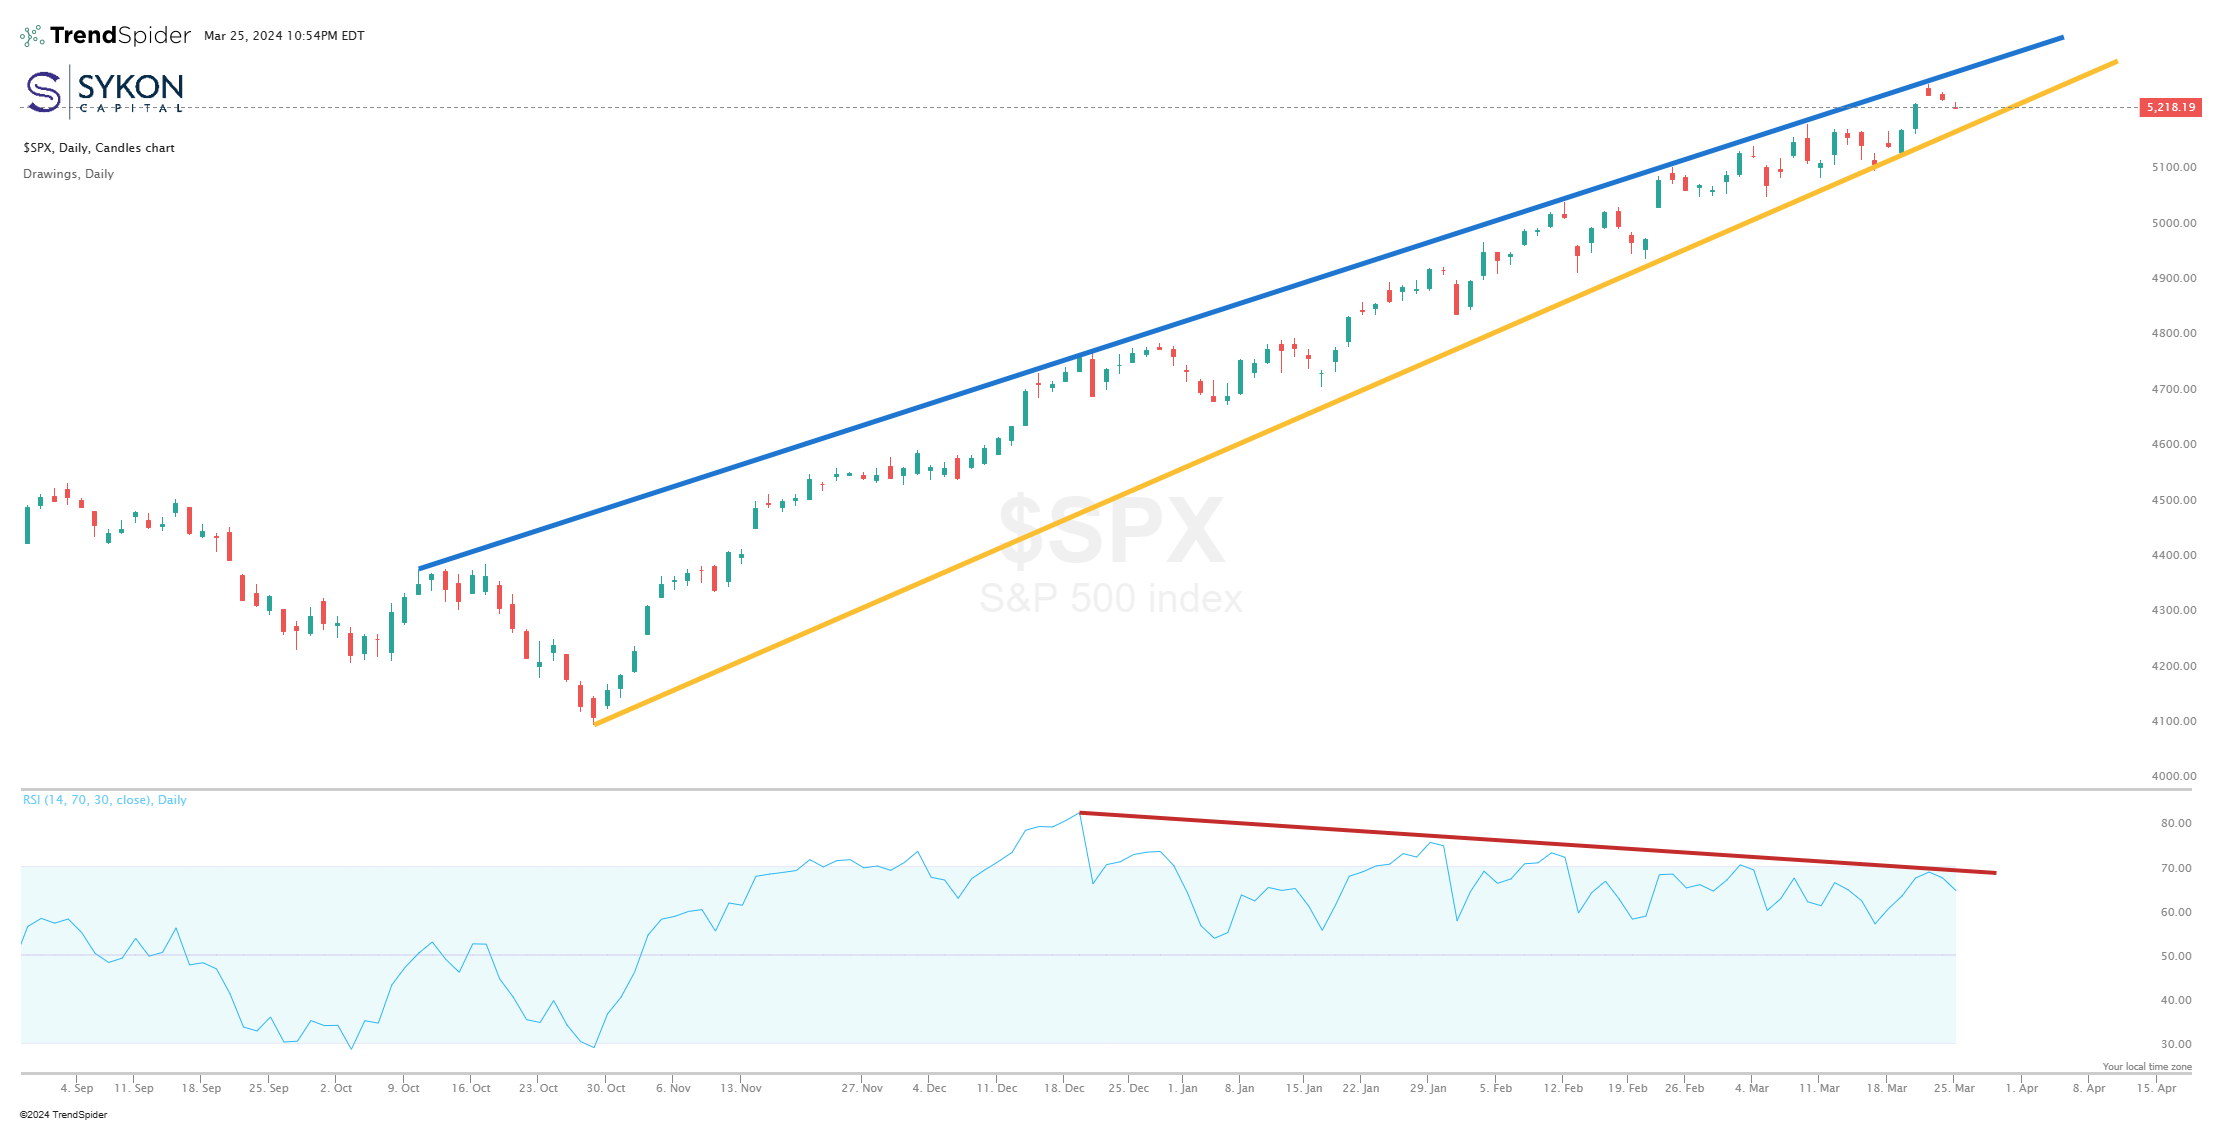
Since the October 2023 lows, the S&P500 index has been forming a rising wedge pattern. At first glance, this can appear to be a bullish pattern since it is clearly moving higher, but rising wedge patterns are often bearish reversal patterns. As the S&P500 index is increasing, the range of trading is narrowing.
To further build the case towards the potential for a bearish reversal, the daily relative strength index (RSI) has been making lower highs with each successive peak in the S&P500 index. This is a classical bearish RSI divergence.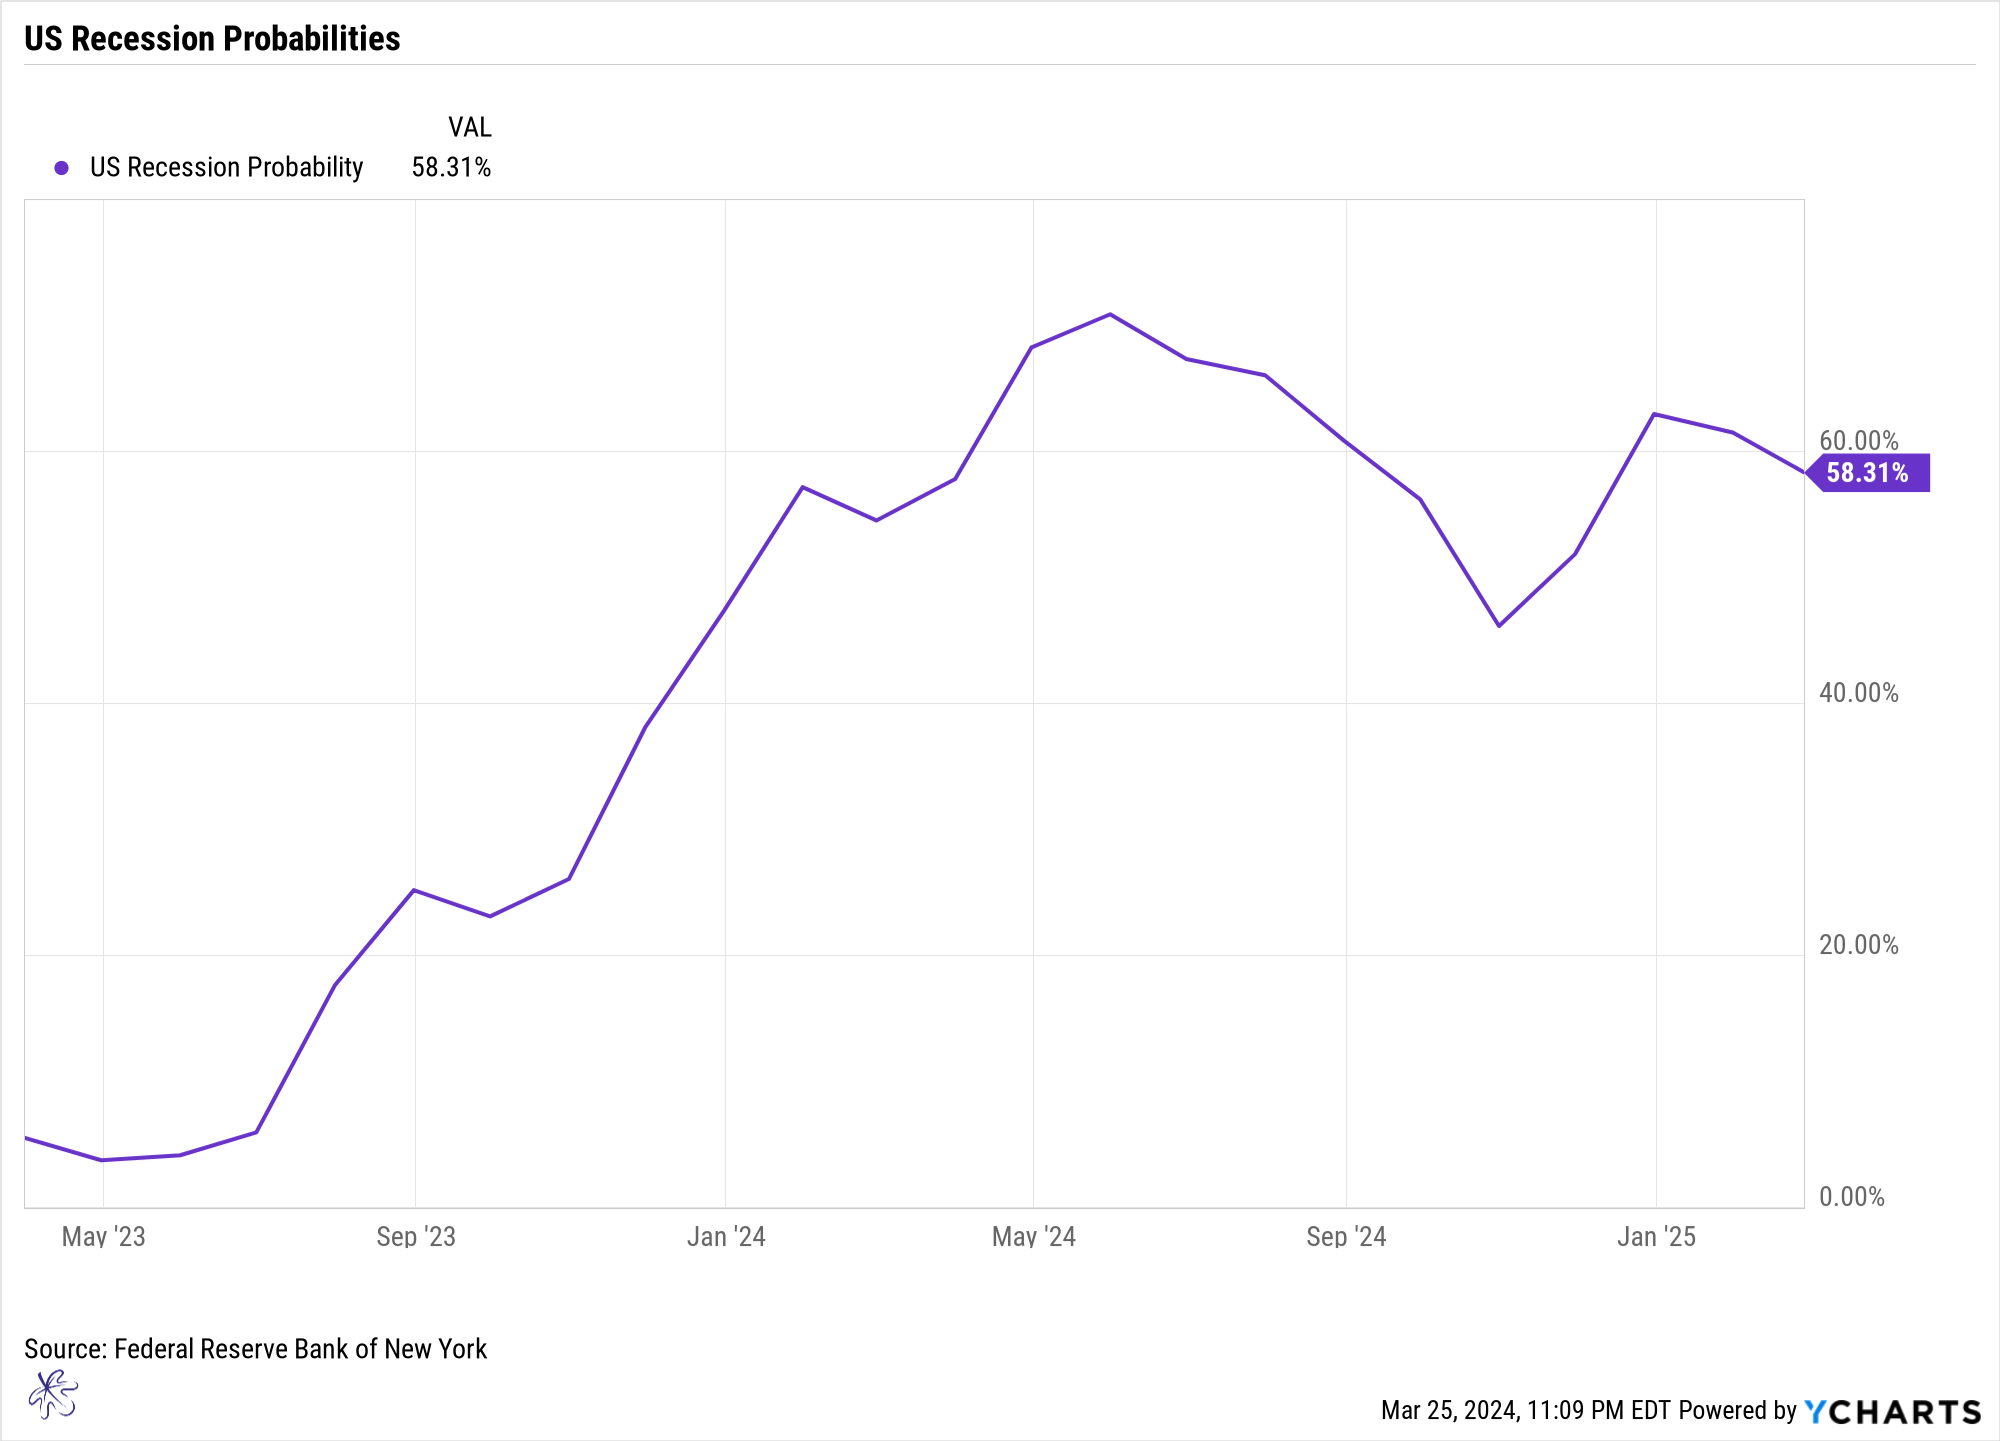
The NY Federal Reserve Bank recession risk model, based on the 10-year minus 3-month treasury yield curve, peaks over the next two months. It will reach a level of 70.85% in May. This is the highest level of recession risk since June of 1982.
This indicator has proven to be a very difficult timing mechanism, but when combined with other technical patterns, such as a rising wedge and RSI divergence, it can provide very important context.
There are a couple of important steps one can take to help protect their portfolio.
1) Ensure you are regularly rebalancing your portfolio so that your asset allocation is within its intended tolerance levels. During periods of rapid appreciation, portfolios can unintentionally overweight the positions that have been appreciating and introduce excess risk.
2) Have a plan in place to help manage portfolio risk. For example, if the S&P500 index breaks the lower yellow support line on the wedge, this may mean that that there is going to be an expansion of volatility in the market and your portfolio could experience substantial losses. What is your action plan if this happens?
Stay patient and disciplined. Have a process in place and be sure to know what levels of risk and loss you are comfortable with.
This is what we do for our clients every day.
We are a fee-only RIA firm focusing on downside protection. We are objective and put our clients’ interests first.
Send me a message if you’d like to talk about being a part of what we do, either as a client or as an advisor.
