The 4 Pillars of Market and Economic Strength
By Todd Stankiewicz | CIO, SYKON Capital | Portfolio Manager, Free Markets ETF (FMKT)
If you have been following us, you are probably familiar with our 4 pillars of market and economic strength. These are:
1) The 4-week moving average of initial unemployment claims.
2) High Yield Credit Spreads.
3) The 10-year minus 3-month US Treasury Yield Curve
4) The long-term momentum of the US Equity Markets.
Each of these indicators has been chosen because of their long-standing reliability at providing objective data as to the state of the U.S. economy and markets. We are going to review each of these and discuss the potential implications for your portfolio.
4-Week Moving Average of Initial Unemployment Claims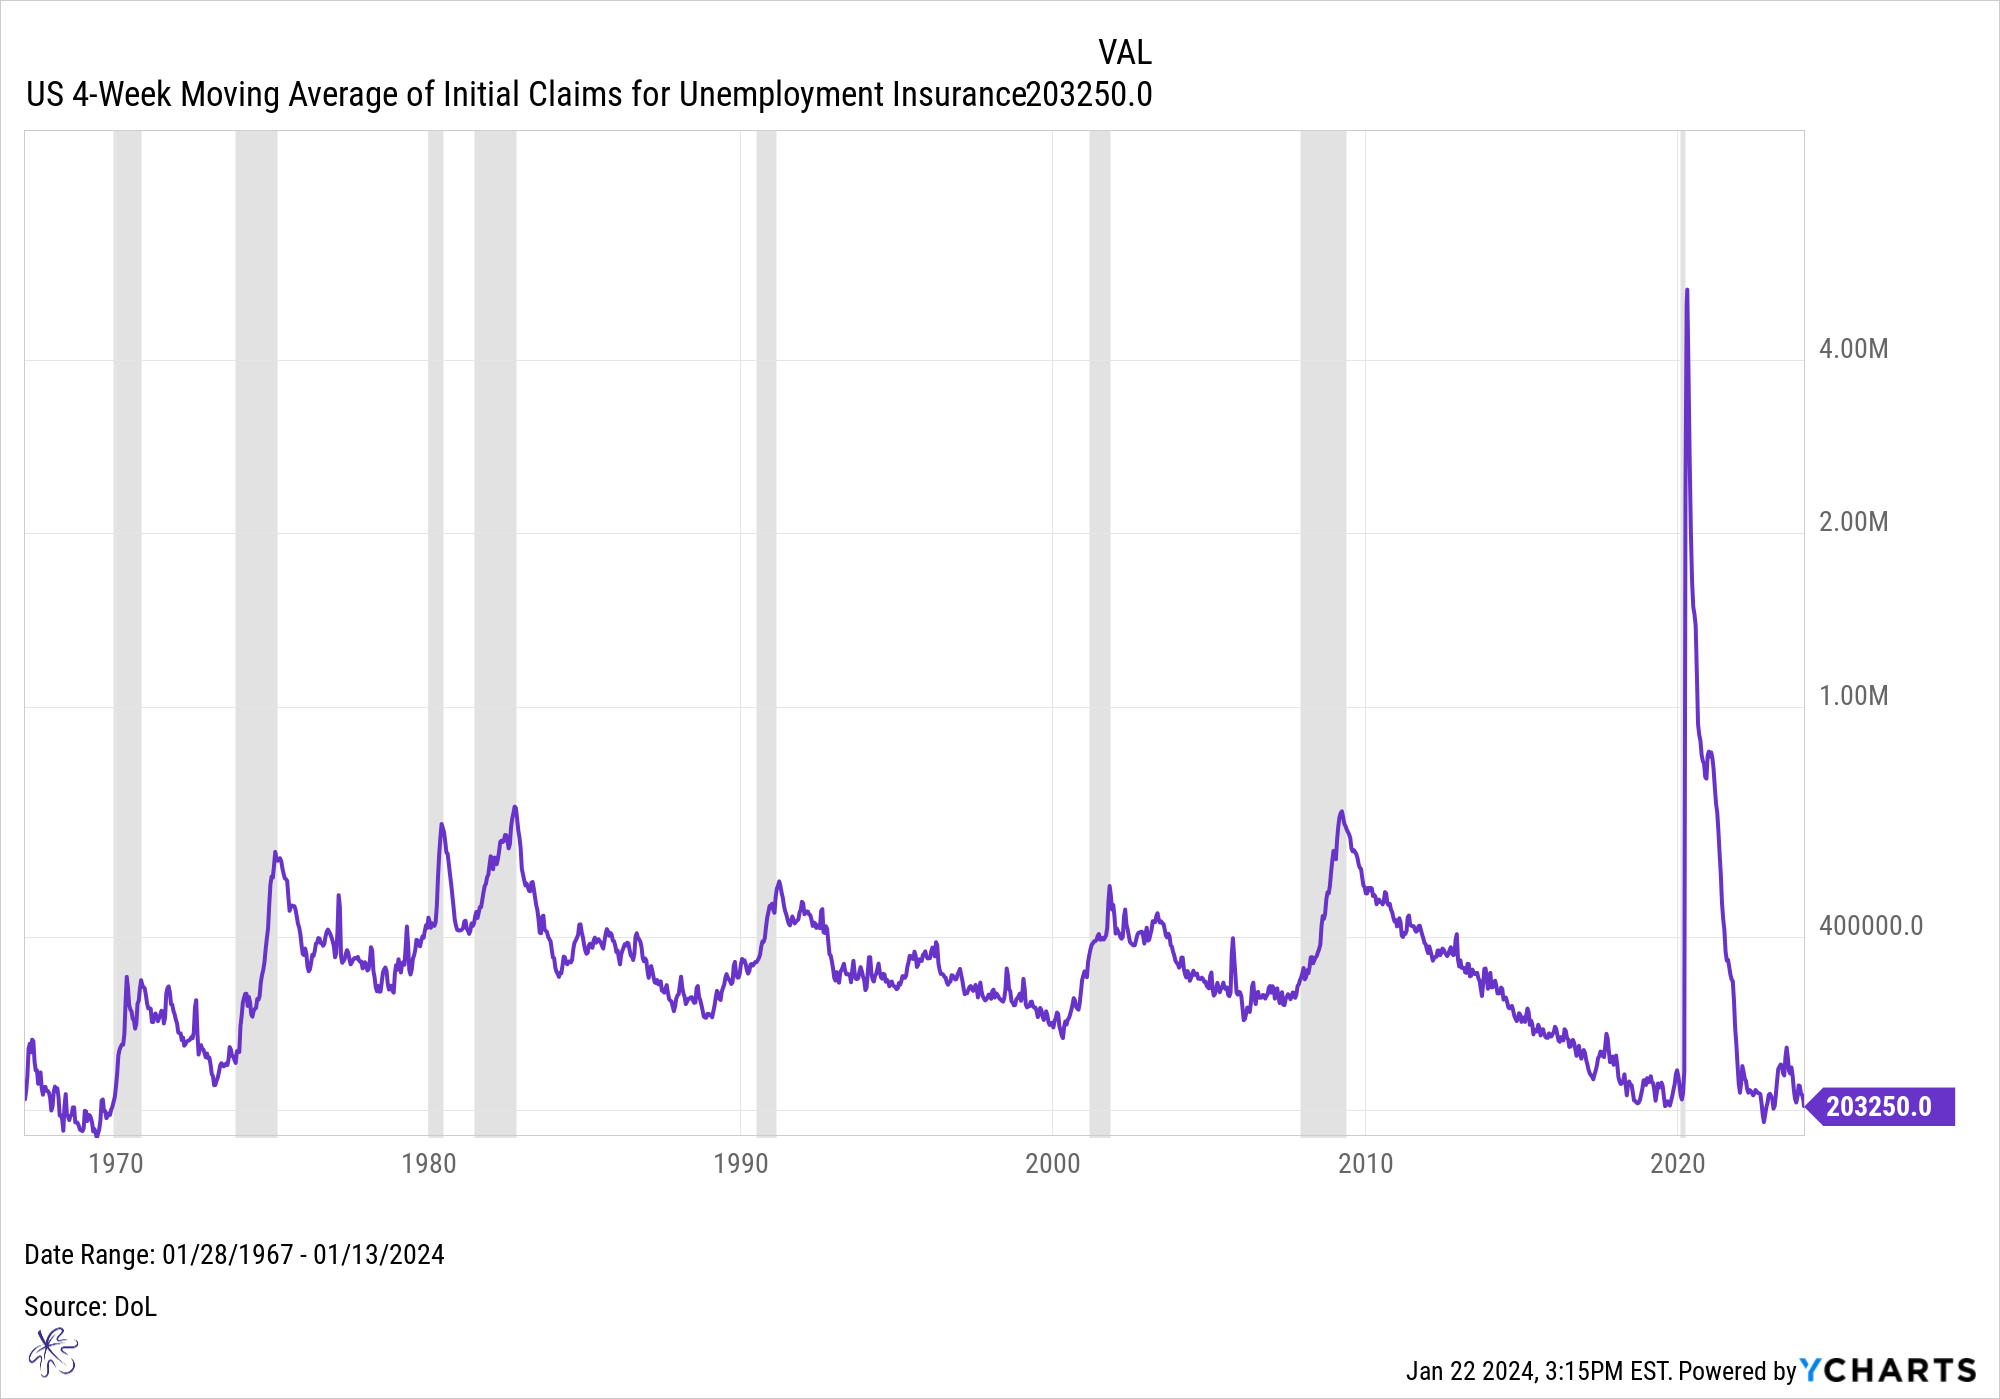
Initial Unemployment Claims are an important coincident indicator for the economy, because in times of economic stress, businesses tend to lay off employees. This chart highlights past recession with the grey bars. In each of the 8 recessions, unemployment insurance claims had spiked concurrently with each respective recession.
The most extreme spike was during the Pandemic of 2020. Since this time, unemployment claims have been close to historic lows.
This indicator tells us that the current employment environment is robust on a macro level. We continue to watch for a shift in this trend to the upside for hints of economic strength. Remember, it is not always the absolute level of the data that is important but the trend of the data. Is it getting better, staying the same, or getting worse.
High Yield Credit Spreads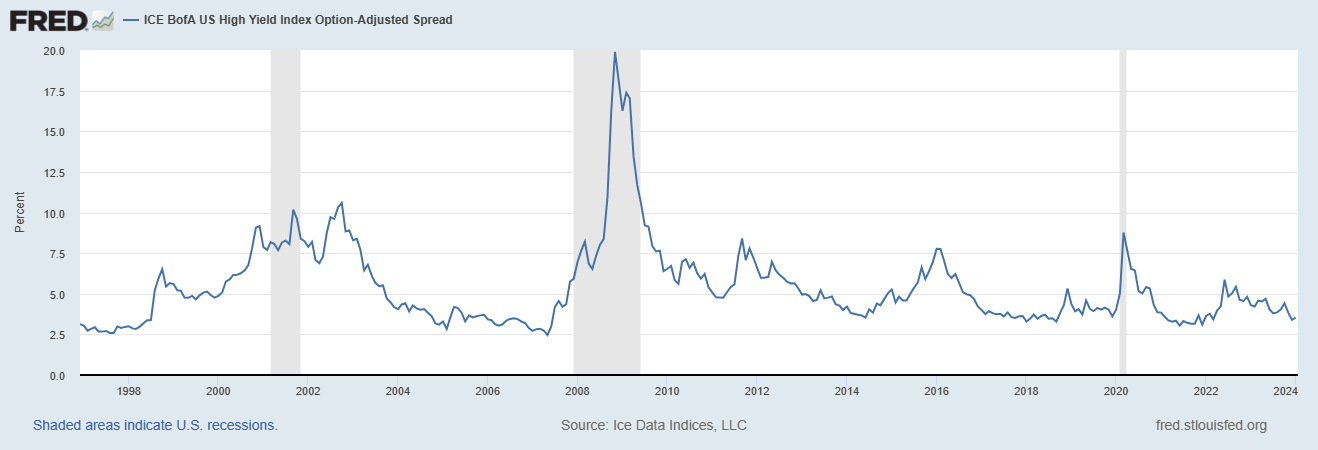
Much like initial unemployment insurance claims, high yield credit spreads can provide important insights into the current state of the markets. This spread represents the difference between yields on treasury bonds and below investment grade bonds. Options adjusted high yield credit spreads tend to widen when the market is pricing in increased risk. This is because market participants are demanding more compensation for the risk they are taking when buying lower quality credits.
During the previous 3 recessions, the dot-com bubble burst, the Great Financial Crisis and the Pandemic of 2020, options adjusted spread widened substantially. Based on the current historically tight levels of high yield credit spreads, it would appear that the current economic conditions are positive.
But this indicator warrants further commentary. Notice how the credit spreads tend to move in cycles. They oscillate from tight to wide over time. The current credit spreads are experiencing some of the tightest conditions in the past 25 years. This increases the likelihood that the next meaningful move in credit spreads is not going to be tighter, but may in fact be a widening.
This carries important consideration for your asset allocation. In times of very tight credit spreads, it often makes sense to increase the credit quality of your fixed income portfolio. This is because high yield bonds are technically expensive on a historical basis and an investor is not being fairly compensated for the additional credit risk.
While high yield credit spreads are objective indicators of current conditions, next we move to indicators that are forward looking in nature.
10-year minus 3-month US Treasury Yield Curve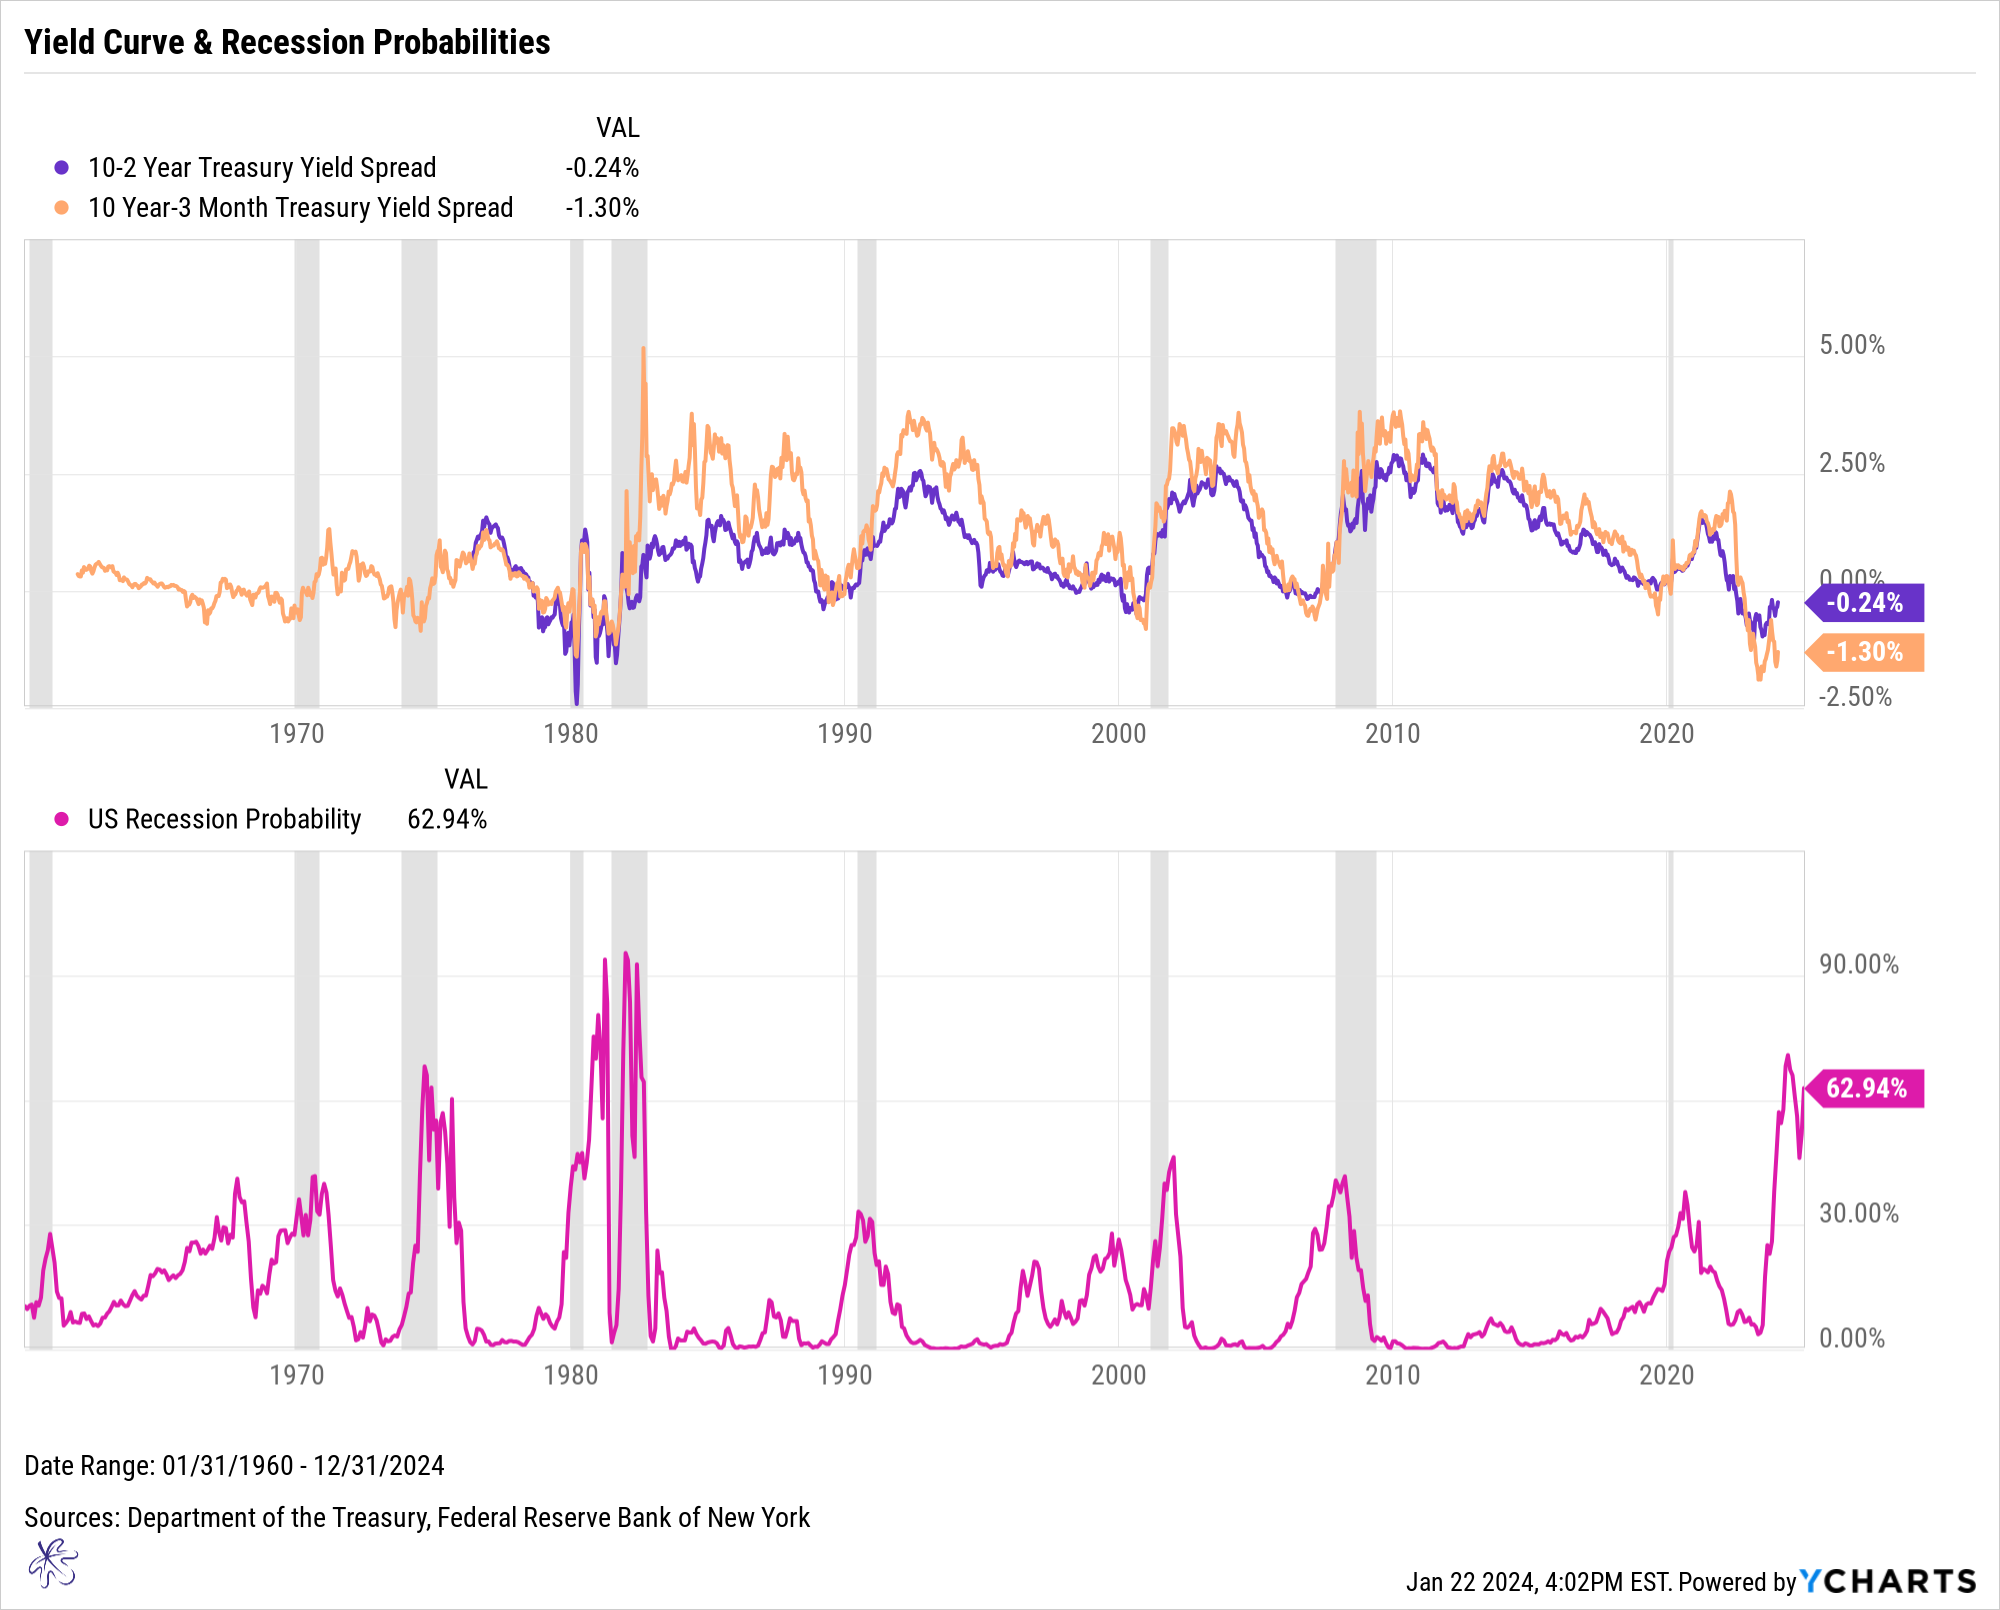
The 10-year minus 3-month treasury yield curve (orange) is historically one of the most reliable indicators of recession probabilities (pink). An inversion of this yield curve will cause spikes in the recession probabilities looking forward 12 months. To really wrap your head around this, the yield curve action that occurred in March of 2019, caused recession probabilities to spike in March and April of 2020. This was exactly when the Pandemic recession occurred. The unbelievable thing is that no one had even heard of Covid back in March of 2019.
It wasn’t even a thing.
Today, we are seeing recession probabilities spike to the highest levels since the 1970’s and early 1980s. This was not a particularly great time for the economy.
While this indicator has a very strong track record of foretelling recessions, it is difficult to use as a timing tool, because recession probabilities can stay elevated for extended periods of time. From a portfolio perspective, one does need to respect the reliability of this indicators and use it to provide context to investment allocation decisions.
In this case, you may want to ensure you are using assets that have low correlations to ensure proper diversification. You should also consider rebalancing after the recent run up to ensure your stock to bond mix is appropriate.
Long Term Equity Momentum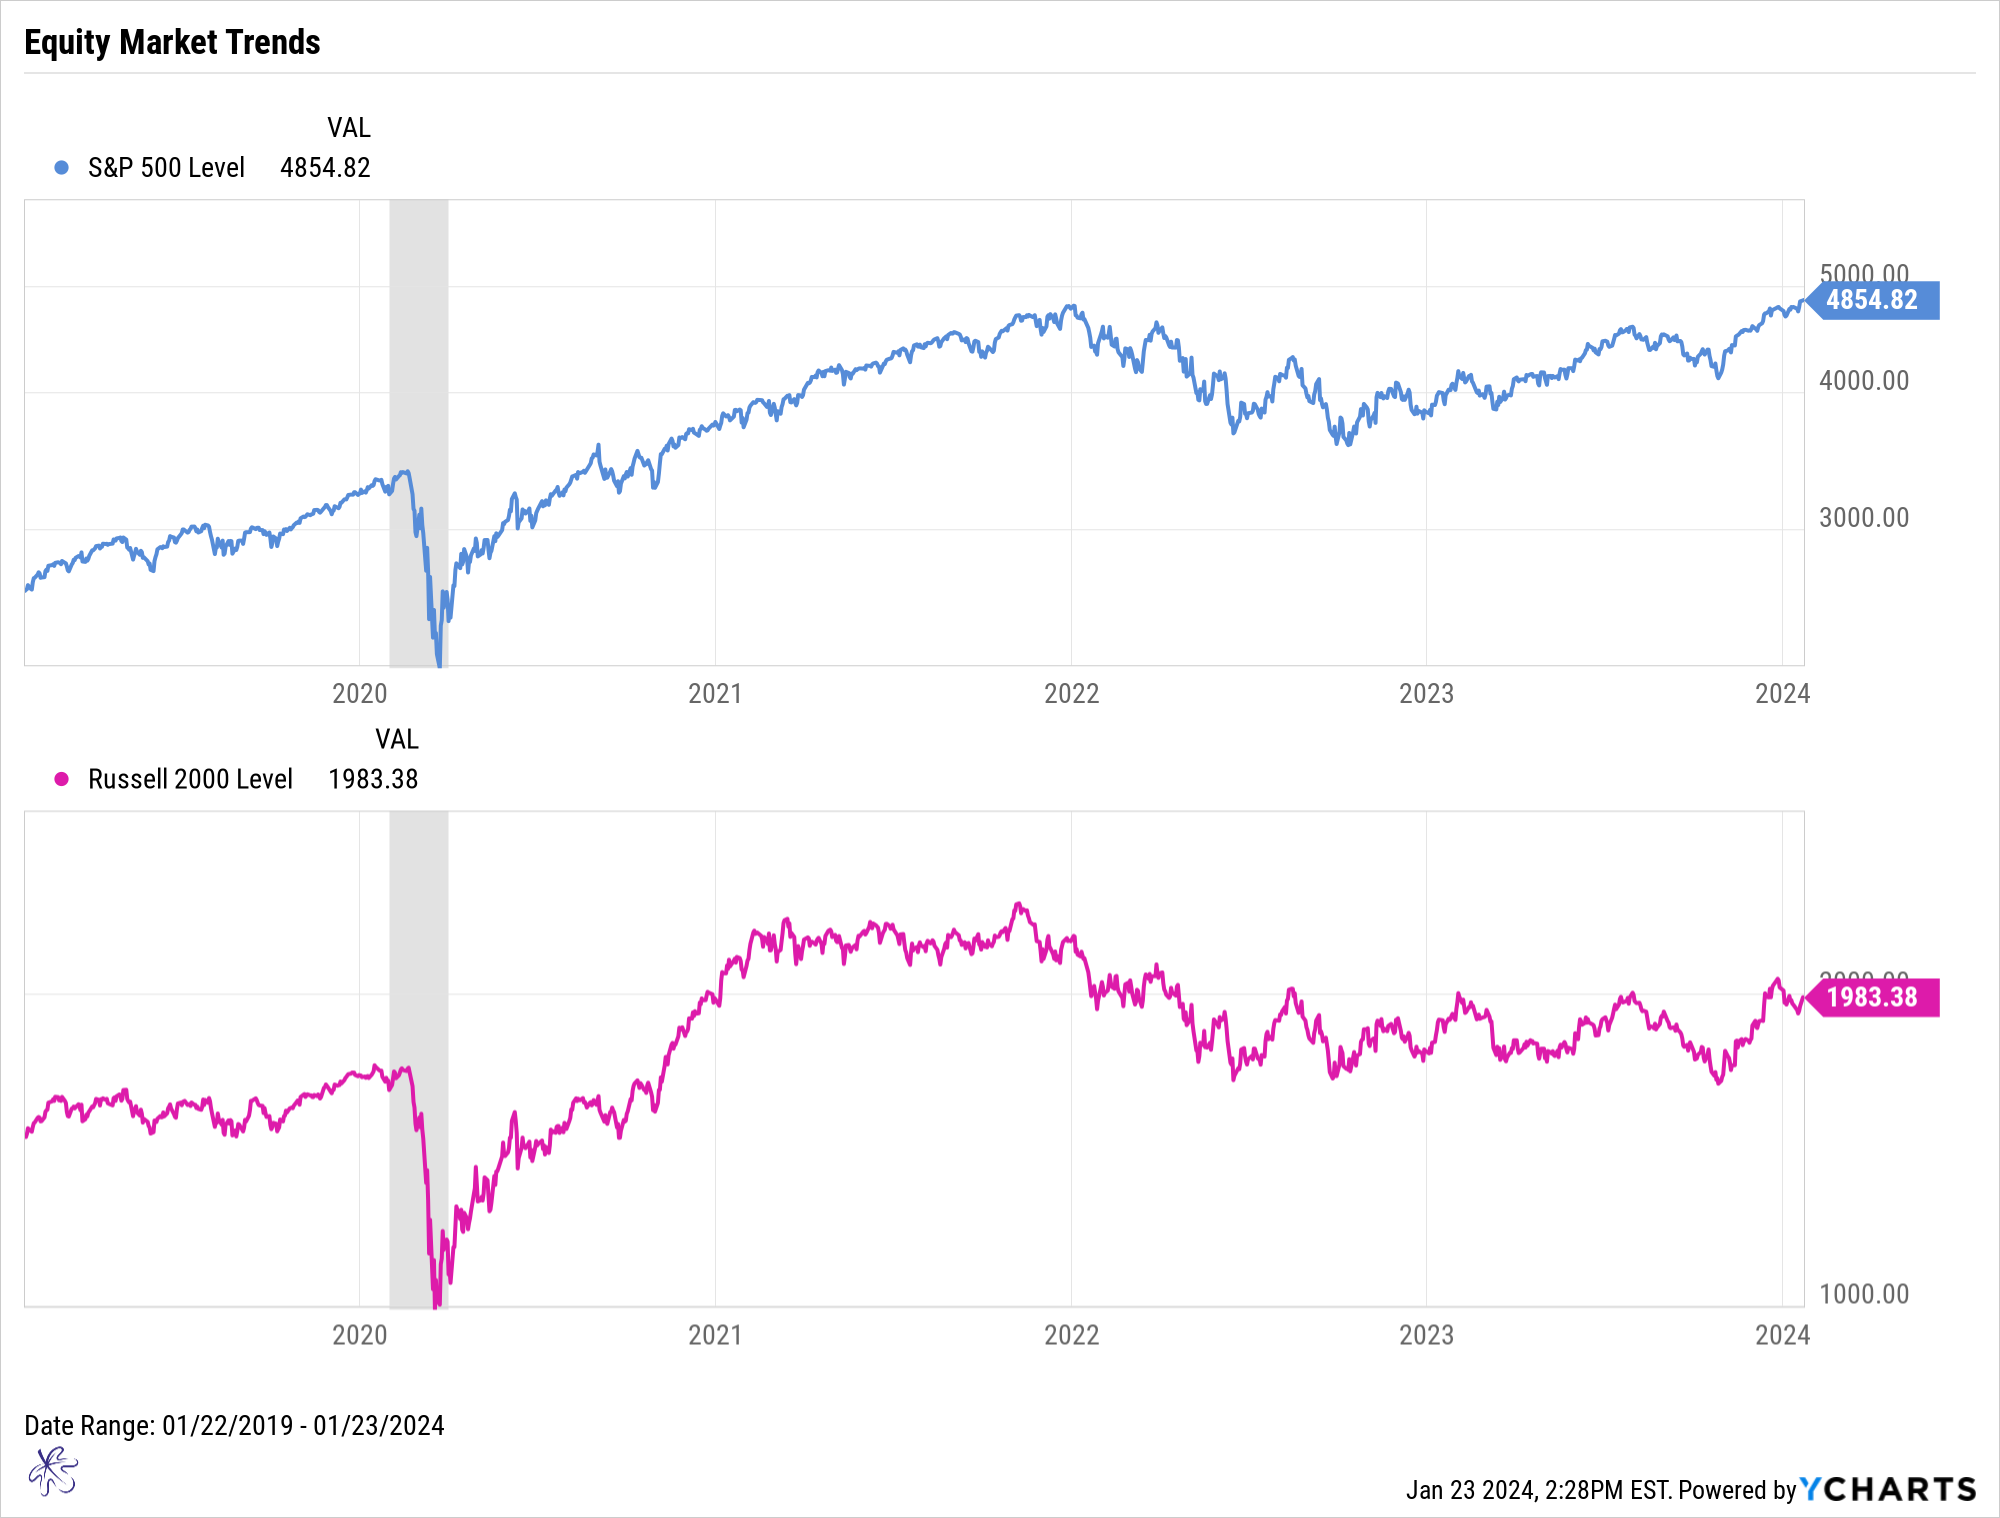
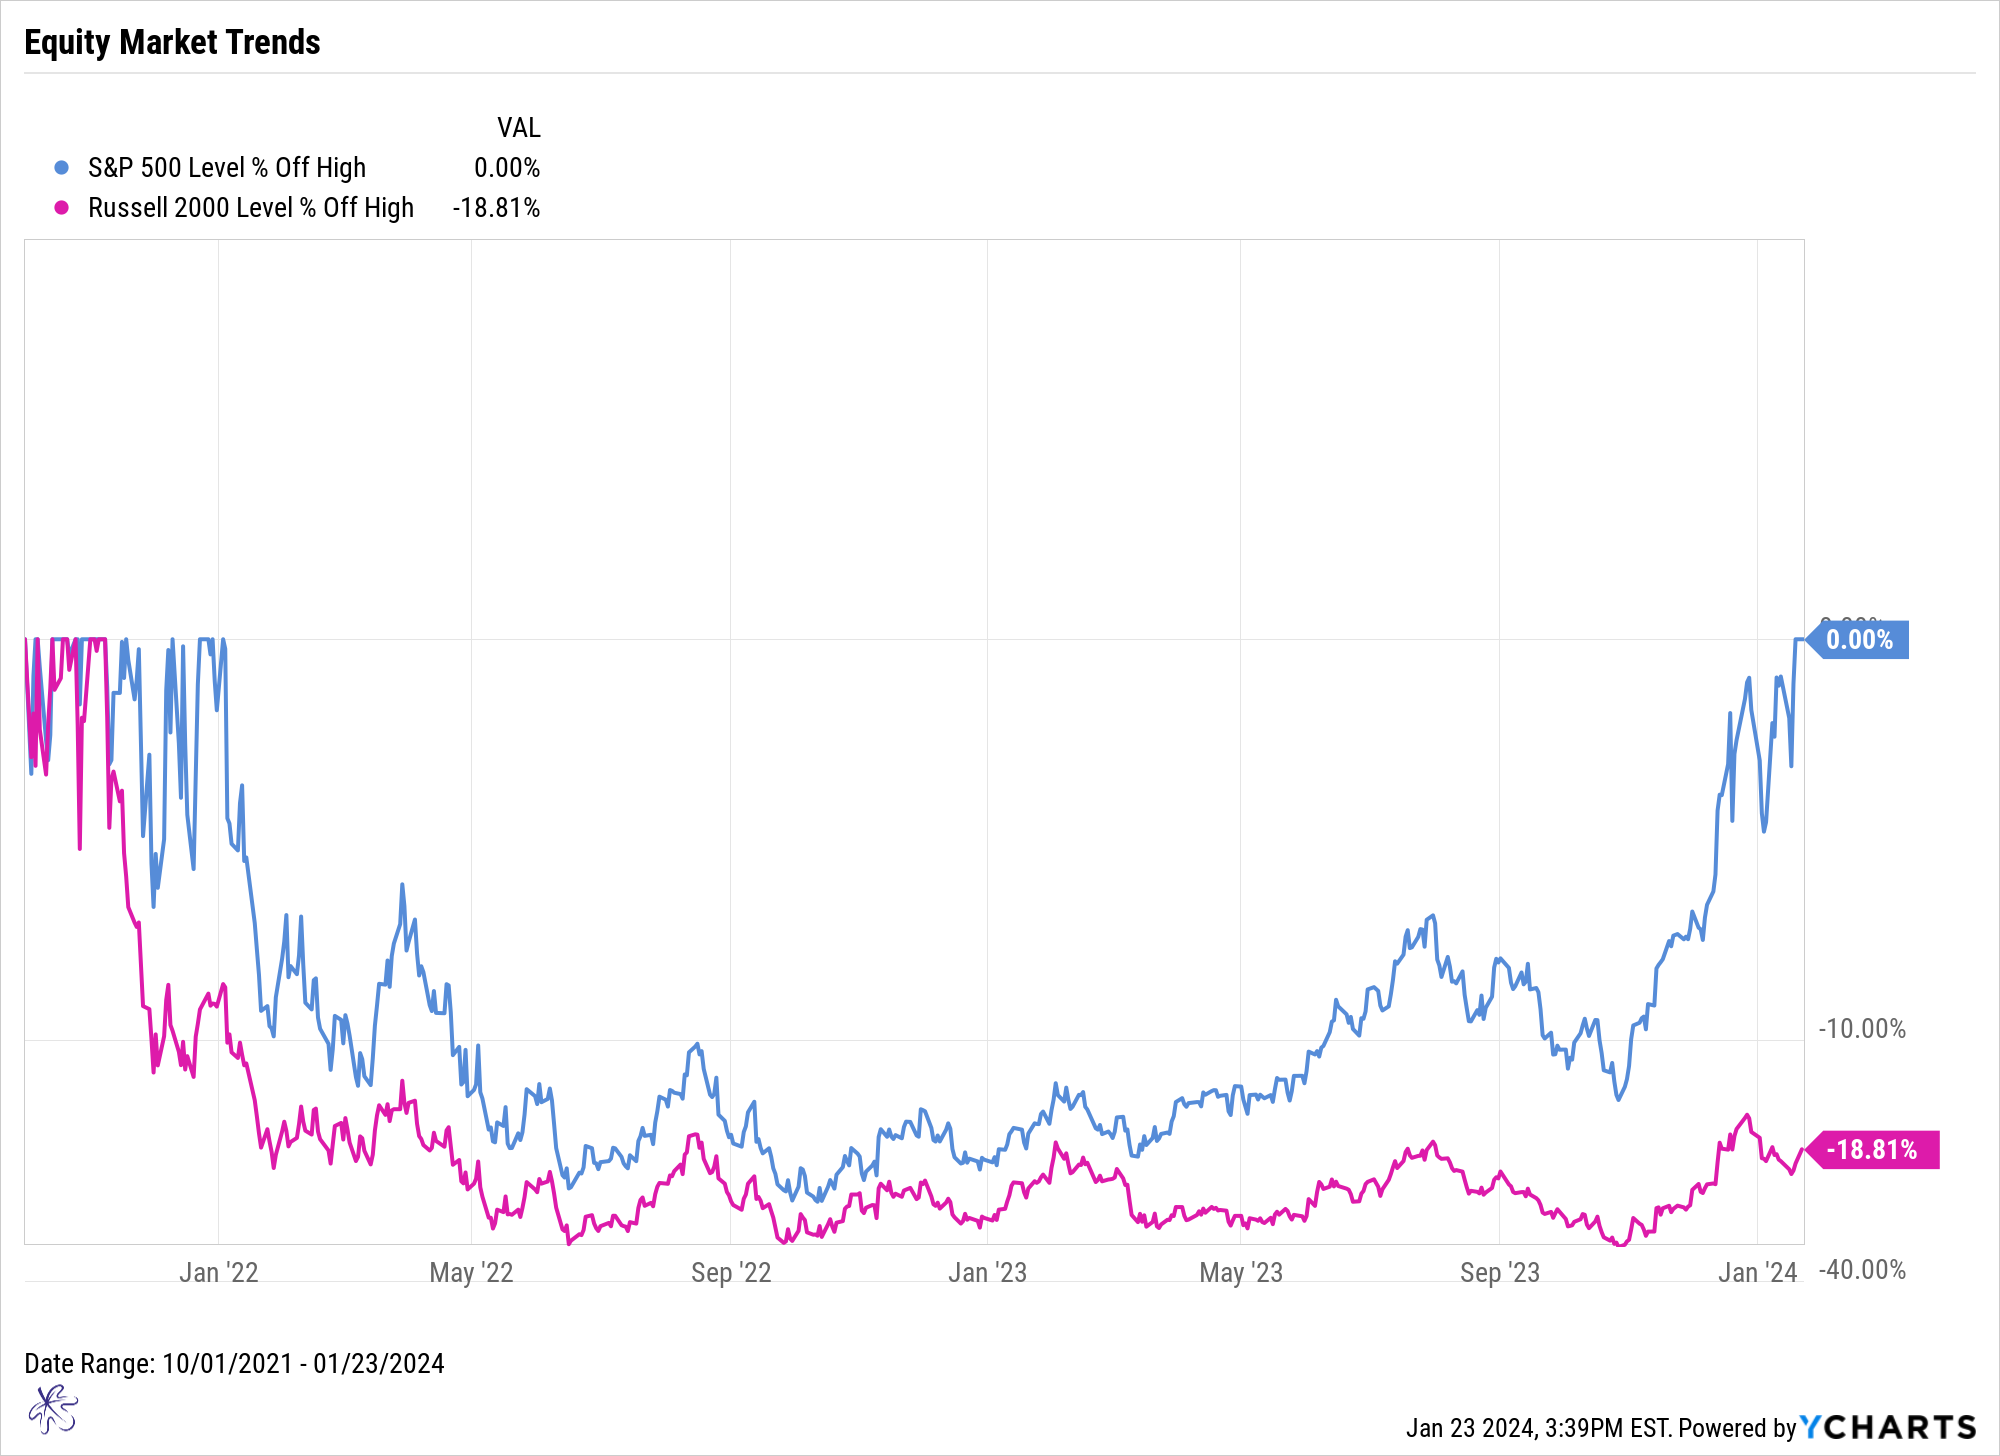
Momentum is the tale of two markets. Large cap US equities have risen back to the previous highs set in late December of 2021, but the small cap Russell 200 index is still more than 18% off its highs. The reality is that the broader market is not making new highs, it has been led by a handful of the largest capitalization stocks.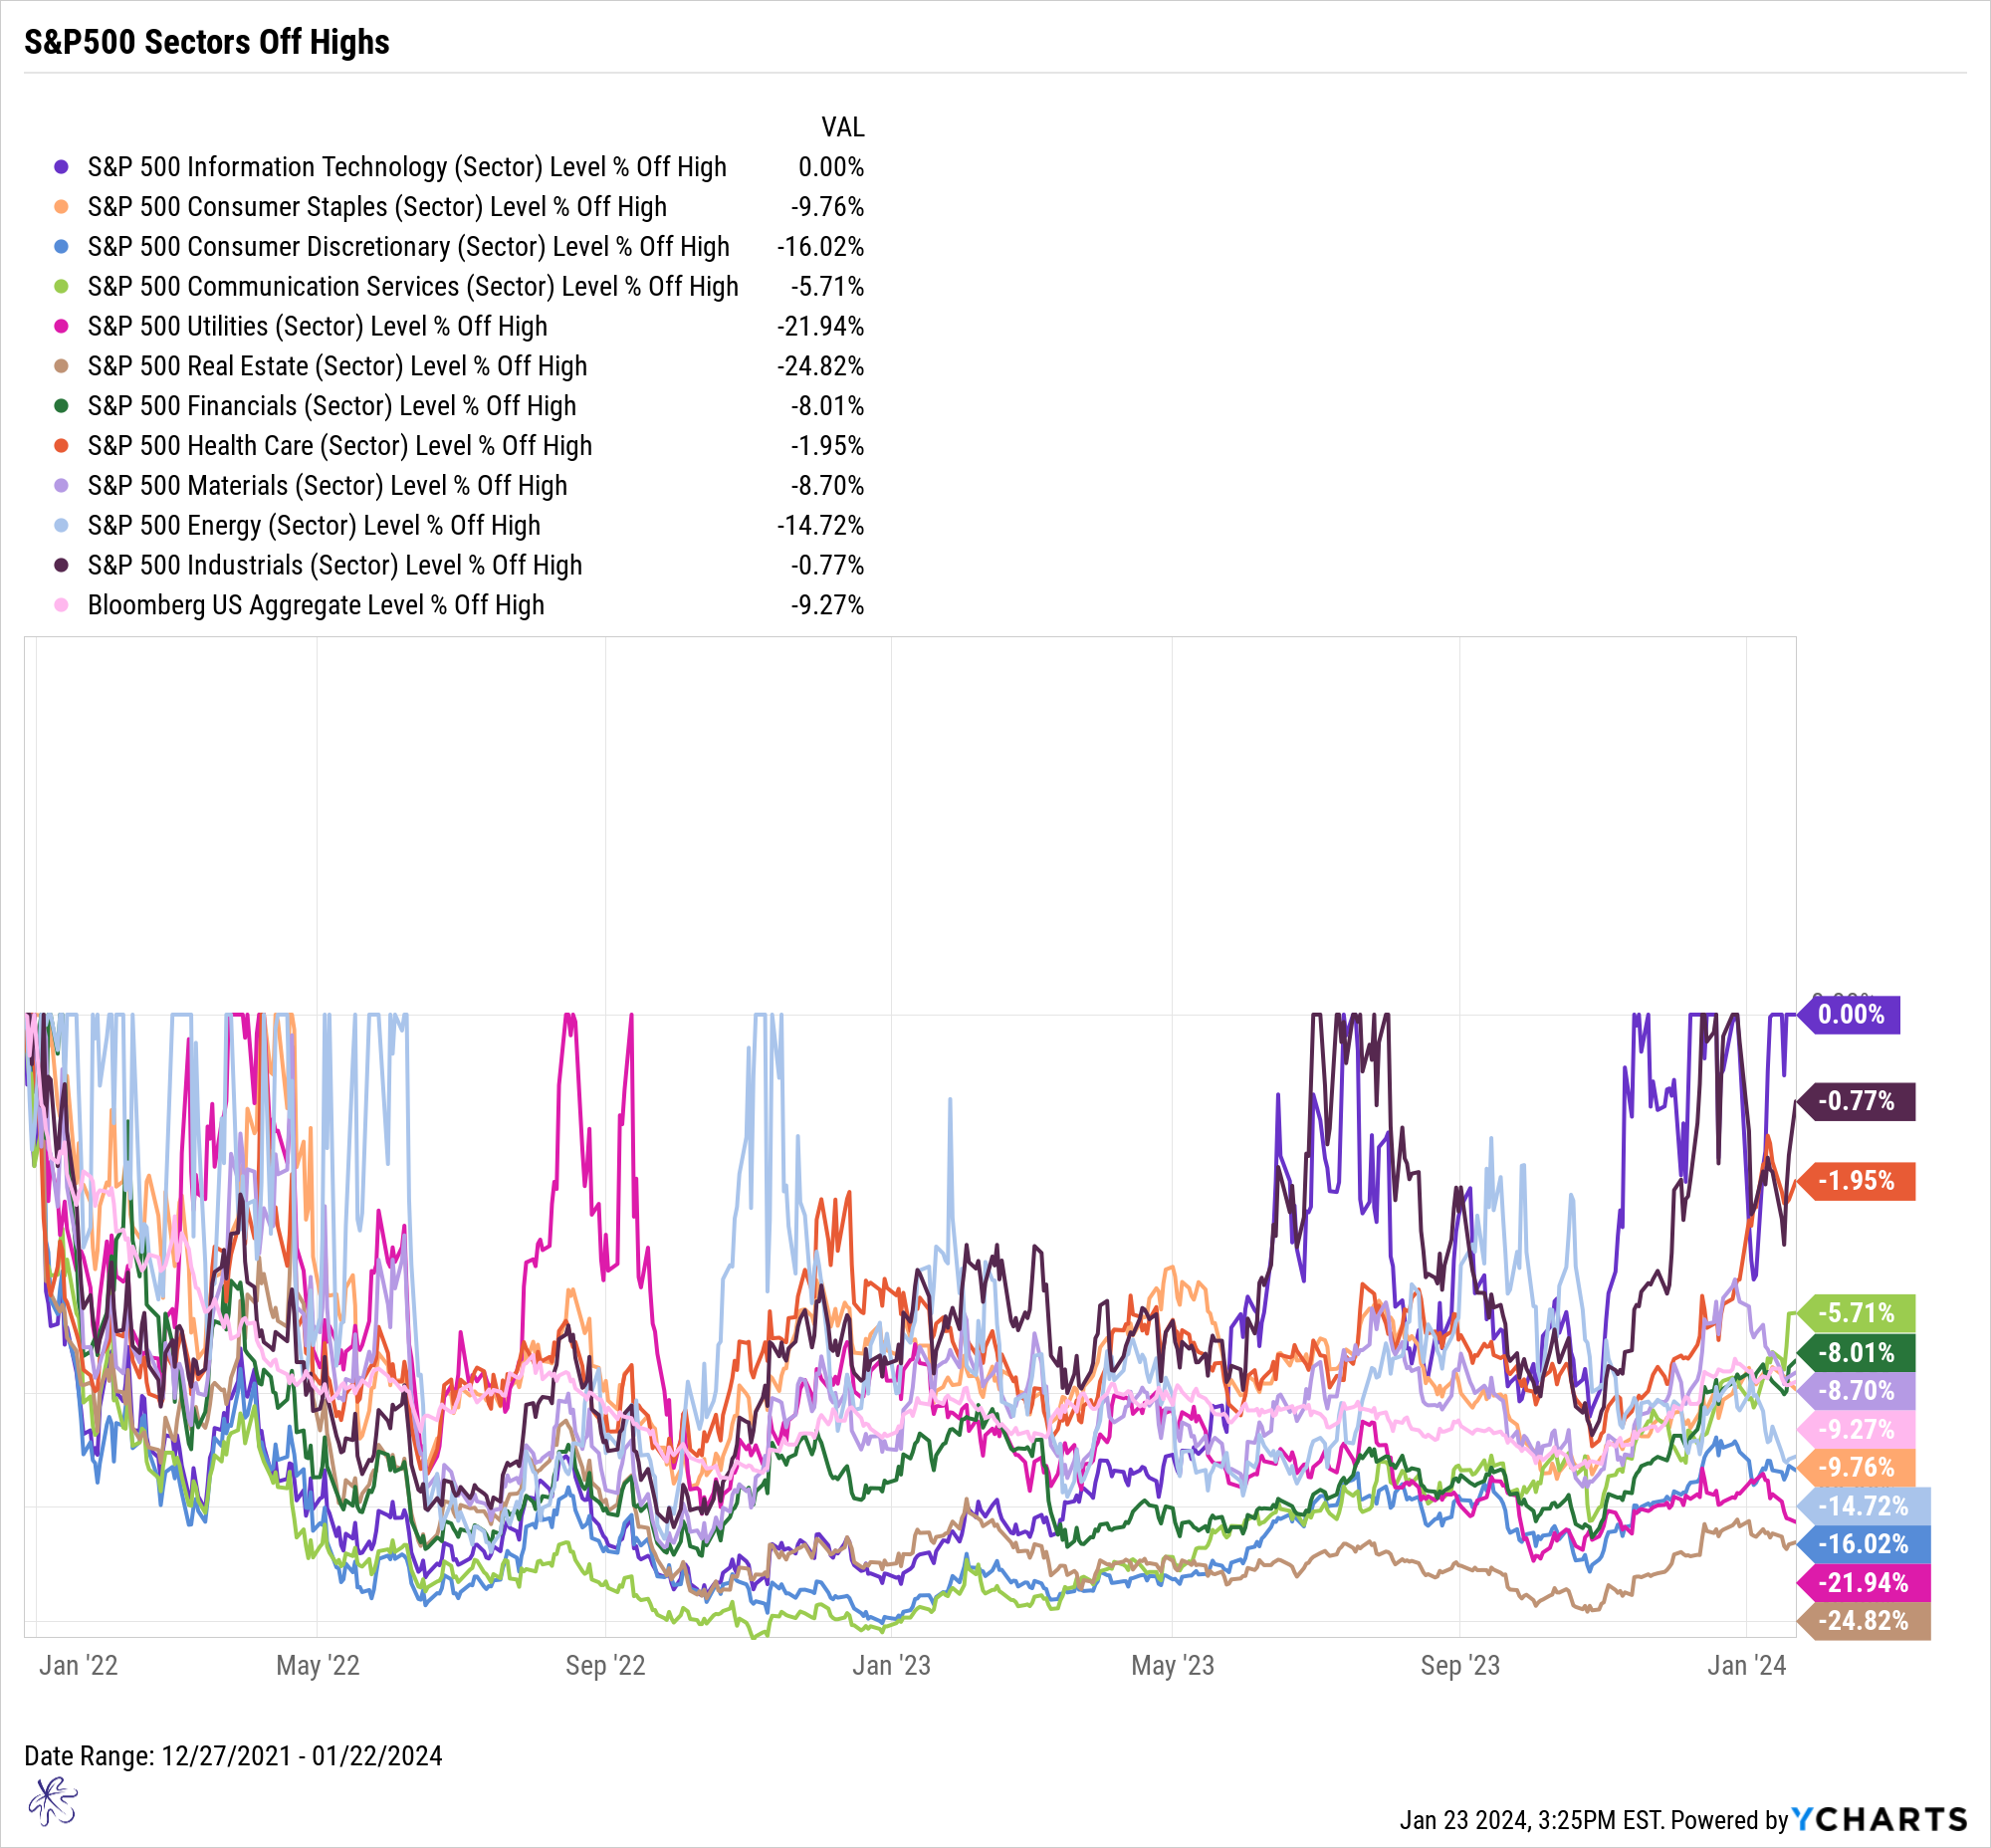
If we drill down even further, we can see that only one sector of the S&P 500 is making new highs, Information technology. That is only 1 sector out of 11 in the S&P500. Even more, 8 out of 11 Sectors at down more than 8% from the peaks.
There are some distinct considerations based on these current indicators. First, the current economic backdrop is favorable when you consider tight credit spreads and the low levels of unemployment insurance claims. But forward-looking indicators are far less favorable. The yield curve is still inverted, and we are approaching peak recession probabilities during 2024.
While everyone shouting about the new bull market, I still contend that the broader market is stuck in a market correction at best. Maybe even a bear market. This is hardly a sign of robust conditions going forward. I may sound like a broken record, but it is still too early to declare victory over inflation and the proverbial soft landing. I am not saying it can’t or won’t happen. In fact, I really hope it does. But the data is objective.
You may be wondering what you do with all this information. Here are the important things to focus on:
1) If your allocation is the same as it has been over the past 2 years, look back to 2022 and see what happened to your portfolio. If you were uncomfortable then, implement a reallocation to help reduce the portfolio risk by adding assets that have low correlations.
2) If you are comfortable with your portfolio allocation and were not concerned during the 2022 market selloff, then be sure to rebalance your portfolio so that your overall asset allocation is corrected for any potential asset drift.
3) Do not hesitate to use cash tools to help manage risk. With the risk-free rate more than 5%, the hurdle for the equity risk premium is very high.
4) Due to tight credit spreads, consider increasing the credit quality of your fixed income portfolio.
On our next post we are going to talk about a trifecta of overbought conditions. Last time we saw this trifecta was back in December of 2021, so be sure to follow us on social media, the links are below.
