The Bond Market Isn't Broken. Your Strategy May Be.
By Todd Stankiewicz | CIO, SYKON Capital | Portfolio Manager, Free Markets ETF (FMKT)
In my view, the rate cut trade appears to be over.
For much of 2025, equity markets rallied hard on a single narrative: the Federal Reserve was going to ease aggressively. By late 2025, I recall the CME FedWatch Tool was pricing a terminal Fed Funds rate around 300 basis points. Bond investors positioned for falling rates. Equity markets priced in easy money. And there was genuine optimism around potential Fed leadership changes that could accelerate the easing cycle.
Then inflation started turning again.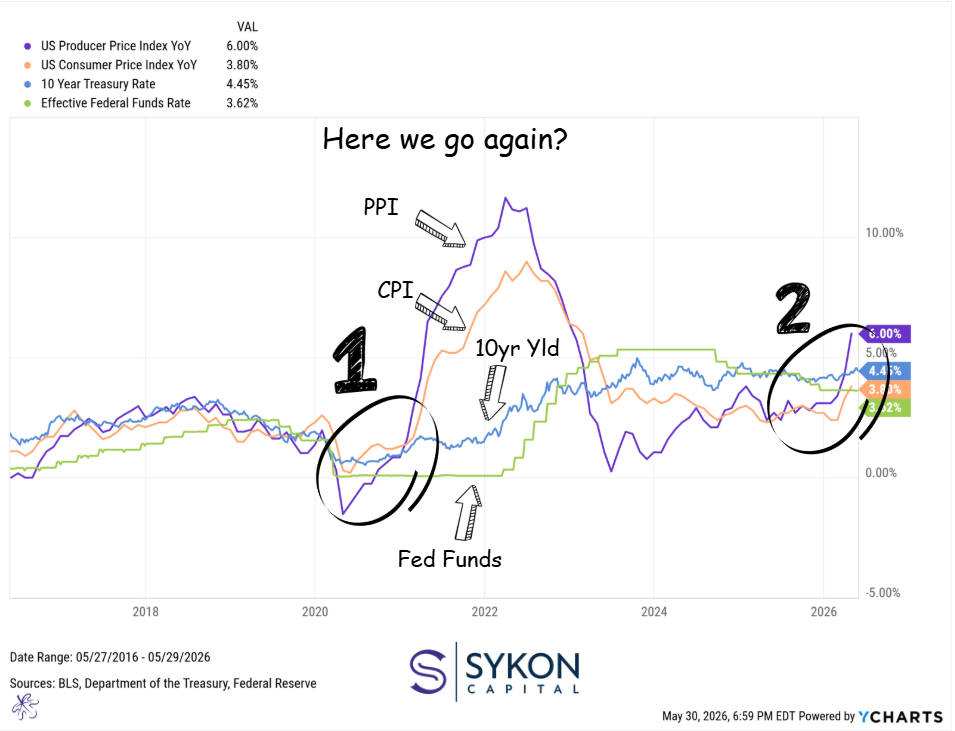
Chart 1: PPI at 6.00%, CPI at 3.80%, 10-Year Treasury at 4.45%, Effective Fed Funds at 3.62%. The same sequential pattern that preceded the 2021-2022 bond selloff is re-emerging.
The Pattern Nobody Wanted to See
Look at the chart above. In the 2020 cycle, the sequence played out in a predictable order: the Producer Price Index (PPI) turned sharply upward first, followed by the Consumer Price Index (CPI), followed by 10-year Treasury yields climbing, and then the Federal Reserve ultimately beginning to tighten monetary policy. Most market participants watched this unfold in real time and were still caught off guard by how quickly bond prices responded.Today, the same sequence may be be developing again. PPI is running at 6.00% year-over-year [2]. CPI stands at 3.80% [3]. The 10-year Treasury yield sits at 4.45%. [4] The Effective Fed Funds Rate is currently 3.62% [5]. Geopolitical pressures, including ongoing tensions in the Middle East, are among the forces contributing to commodity-side price pressure, but the transmission mechanism is the same: supply-side disruption flows into producer prices, which eventually moves into consumer prices, which ultimately forces the Fed to respond.
In my view, this is not a coincidence. It looks like the same sequence I have seen before.
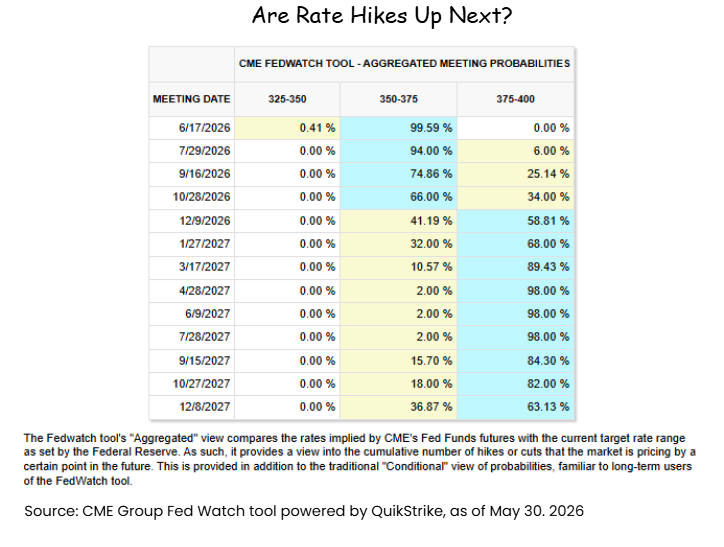
Chart 2: The CME FedWatch Tool now prices a 58.81% probability of a 25bp rate hike to the 375-400 range by December 9, 2026, a stark reversal from late 2025, when cuts to 300bps were the consensus expectation.
What the Market Is Now Pricing In
Less than a year ago, the market consensus pointed toward a terminal rate in the 300 basis point range. That view has almost entirely reversed. As of today, the CME FedWatch Tool shows June 2026 at 99.59% probability of rates remaining at 350-375. But December 9, 2026 tells a different story: a 58.81% probability of a 25 basis point hike to the 375-400 range [6].Think about how significant that shift is. We went from markets pricing aggressive rate cuts to markets now pricing the possibility of rate hikes, in roughly six months. This is a meaningful change in the monetary policy backdrop, and it has direct implications for every bond portfolio that was constructed with the assumption that easier money was the path forward.
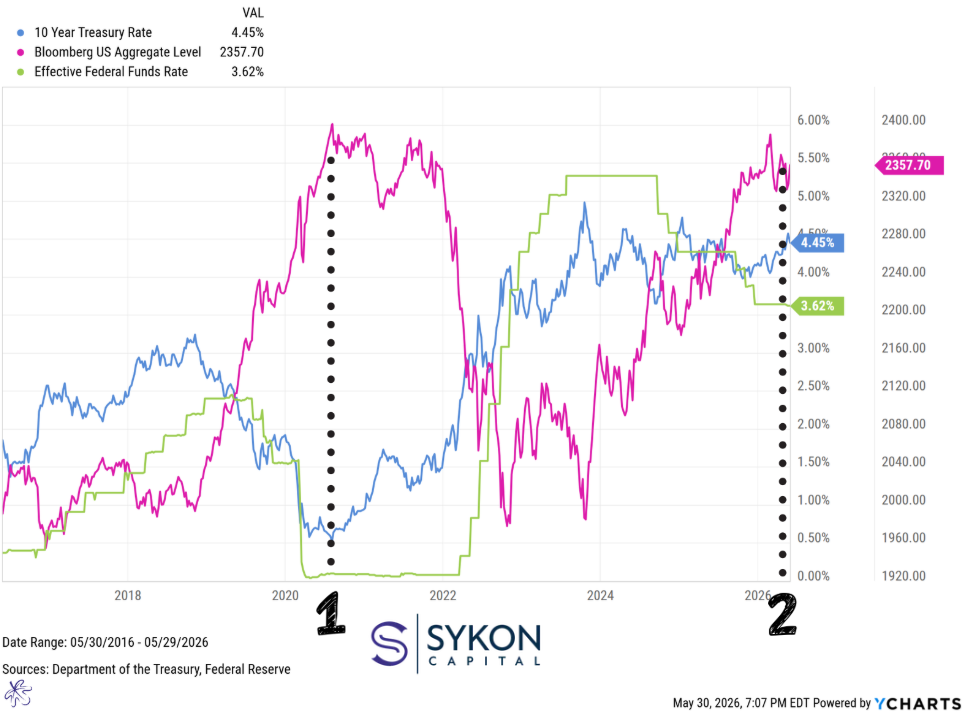
Chart 3: The Bloomberg US Aggregate Bond Index sits at 2,357.70. The dotted line marks today’s inflection point, structurally similar to the setup that preceded the 2021-2022 drawdown. This is not a prediction. It is a question worth asking.
What This Means for the Aggregate
The Bloomberg US Aggregate Bond Index, in my view, makes this dynamic visible. On line 1 on the chart above, you can see what happened after the 2020-2021 inflation surge: the Aggregate experienced a significant drawdown as yields climbed sharply. Line 2 marks where we are today, a similar inflection point, with the Aggregate at 2,357.70, the 10-year yield at 4.45%, and Fed Funds at 3.62%.The Agg is not a dynamic instrument. It is an index built to represent the broad investment-grade bond market, not to adapt as the rate cycle evolves. In a rising-rate environment, its duration exposure works against investors. In my view, the distinction between passively tracking the Agg and actively managing fixed income allocation may be as meaningful today as it has been in years.
The Private Credit Warning Sign
One of the more underappreciated risks in this environment sits in private credit. Significant refinancing pressure is building toward 2027, with what I believe could be peak maturity stress around 2028. Many of the companies that borrowed during the 2020-2022 low-rate window did so on six-to-eight year cycles. They are going to be refinancing at materially higher rates. Based on what I have been observing in the market, payment-in-kind (PIK) lending appears to be increasing across a number of private credit portfolios, which typically signals that cash interest coverage is under pressure for a meaningful subset of borrowers [8].The question that keeps coming back to me is this: if defaults begin to surface in private credit, what does that trickle effect look like? For the larger financial institutions? For private credit asset managers? For individual investors who have been using private credit as their primary diversifier? Swapping public bonds for illiquid private credit and calling it diversification is a strategy worth scrutinizing carefully right now.
The Earnings Question Nobody Is Asking Yet
Equity markets have been resilient, and part of that reflects genuine optimism around AI-driven productivity gains. I believe that AI is producing real improvements in output for many businesses. But as AI spending accelerates, some companies may be discovering that data and infrastructure costs can balloon in ways that offset those gains, and that is before you account for what tighter monetary policy historically does to earnings multiples at elevated valuations.By most conventional valuation measures, including trailing price-to-earnings ratios on the S&P 500, equities appear, in my view, to be trading at historically elevated levels [7]. Private credit has, in many portfolios, become the go-to diversifier. And traditional fixed income has been written off as broken. In my view, that framing is only half right.
It’s Not That Bonds Are Broken: It’s the Strategy
Earlier this month, Ritholtz Wealth Management launched the Porterhouse strategy in partnership with Franklin Templeton, a concentrated momentum equity separately managed account built around targeting market leaders that are already moving higher [1]. This is a notable departure for a firm that has been among the most prominent advocates of passive, buy-and-hold investing.
What the Porterhouse launch signals, in my view, is meaningful: even some of the most principled, philosophy-driven firms in this industry are acknowledging that certain market environments may call for a more dynamic, active approach. That same logic applies directly to fixed income.
It is not that bonds are broken. It is that the way we have historically allocated to bonds (treating the Bloomberg Aggregate as a static, set-and-forget benchmark) is not designed for a rate environment this fluid and this uncertain. The 60/40 portfolio is not dead. Bonds are not dead. But passive, duration-heavy fixed income in a potentially rising-rate environment has historically been a challenging place to be.
Dynamic bond allocation is not a new concept to me. I have been managing fixed income this way for my clients for more than ten years, adjusting duration as the rate cycle shifts, rotating across credit quality and sector, managing sensitivity to inflation risk. What feels new is that the broader market is only now beginning to ask the same questions I have been asking for a long time.
These dynamics do not play out the same way for every investor. How they affect a portfolio depends on time horizon, risk tolerance, and how the current fixed income allocation is structured. If any of this raises questions worth sitting with, we are here for that conversation. There is no agenda here beyond thinking it through carefully. You can learn more about how we approach fixed income at www.sykoncapital.com or reach out directly at todd@sykoncap.com.
Investing involves risk, including the potential loss of principal. Past performance is not indicative of future results. The information in this article reflects the views and opinions of the author and is provided for educational purposes only. It should not be construed as personalized investment advice. Please consult a qualified financial professional about your specific situation.
About Author
Todd Stankiewicz | Chief Investment Officer, SYKON Capital
Todd Stankiewicz is the Chief Investment Officer of SYKON Capital, a fee-based registered investment advisor with offices in Westchester County, NY and Jupiter, FL. He is a recurring guest on Fox Business and the Schwab Network, where he discusses markets, portfolio strategy, and investor behavior. Todd is also the portfolio manager of the Free Markets ETF (FMKT).
Learn more at www.sykoncapital.com
Sources:
[2] U.S. Bureau of Labor Statistics. “Producer Price Index: Final Demand.” Data as of May 2026. https://www.bls.gov/ppi/
[3] U.S. Bureau of Labor Statistics. “Consumer Price Index for All Urban Consumers (CPI-U).” Data as of May 2026. https://www.bls.gov/cpi/
[4] Federal Reserve Bank of St. Louis (FRED). “Market Yield on U.S. Treasury Securities at 10-Year Constant Maturity.” https://fred.stlouisfed.org/series/DGS10
[5] Federal Reserve Bank of St. Louis (FRED). “Effective Federal Funds Rate.” https://fred.stlouisfed.org/series/EFFR
[6] CME Group. “CME FedWatch Tool: Target Rate Probabilities.” As of May 30, 2026. https://www.cmegroup.com/markets/interest-rates/cme-fedwatch-tool.html
[7] S&P 500 trailing P/E and valuation data available at: https://www.multpl.com/s-p-500-pe-ratio and https://fred.stlouisfed.org/series/CAPE
[8] Author’s market observation. For reference on private credit stress indicators and PIK loan trends, see industry reports published by Pitchbook (https://pitchbook.com), Preqin (https://www.preqin.com), or S&P LCD (https://www.spglobal.com/marketintelligence/en/mi/products/leveraged-commentary-data.html).
Note: Bloomberg US Aggregate Index level (2,357.70) sourced from author’s proprietary Bloomberg terminal data as of May 30, 2026. Bloomberg data is not publicly linkable but is verifiable via Bloomberg terminal subscription.
Questions People Are Searching About This Article
What is dynamic bond allocation and how does it differ from static fixed income investing?Dynamic bond allocation involves actively adjusting the composition of a fixed income portfolio based on prevailing market conditions, including interest rate direction, inflation trends, credit cycle stage, and duration risk. Unlike a static approach that typically tracks a benchmark such as the Bloomberg US Aggregate and holds it without meaningful adjustment, a dynamic strategy shifts exposure across bond sectors, maturities, and credit qualities as the environment changes. In a rising-rate environment, a dynamic approach typically reduces duration to limit price sensitivity to climbing yields, while a static benchmark allocation may remain fully exposed. Dynamic bond management has historically been used primarily by institutional managers and a subset of independent advisors. The broader conversation around this approach is becoming more relevant as the rate environment grows more uncertain and investors are reconsidering what role fixed income should play in a diversified portfolio.
Is the Bloomberg US Aggregate Bond Index still a valid benchmark for bond portfolios?
The Bloomberg US Aggregate remains a useful representation of the broad investment-grade bond market, but its appropriateness as a benchmark for individual portfolios depends on the rate environment and investor objectives. The Agg is a market-cap-weighted index that typically carries meaningful duration risk and was not designed to be actively managed. In rising-rate environments, high-duration fixed income tends to face pressure. As of mid-2026, with 10-year Treasury yields at 4.45% and the CME FedWatch Tool pricing a potential 25 basis point rate hike by December 2026, advisors and investors may want to evaluate whether a more dynamic fixed income approach better serves their risk tolerance and return objectives than simply tracking the Agg. The benchmark itself is not the problem. The assumption that tracking it passively is the right strategy in all rate environments is worth examining.
What does the 2020 inflation cycle tell us about what may happen to bond prices today?
The 2020-2022 inflation cycle offers a relevant historical reference. Producer Price Index (PPI) turned sharply upward first, followed by Consumer Price Index (CPI), followed by 10-year Treasury yields rising, and ultimately the Federal Reserve began tightening monetary policy. During that cycle, the Bloomberg US Aggregate Bond Index experienced what many consider one of its worst multi-year drawdowns on record [2]. As of 2026, PPI is running at 6.00% year-over-year [2] and CPI is at 3.80% [3], with the same sequential pattern appearing to re-emerge. This does not mean the outcome will be identical, but it suggests that investors may want to proactively evaluate their fixed income duration exposure and inflation sensitivity rather than waiting for yields to move further before making adjustments.
How does rising inflation affect private credit portfolios and the refinancing risk investors face?
Private credit portfolios face particular exposure in a rising-rate, rising-inflation environment because much of the underlying debt was originated during the 2020-2022 low-rate window. Many of these companies operate on six-to-eight year refinancing cycles, which means a significant volume of private credit debt may need to be refinanced between 2027 and 2028 at materially higher rates than where it was originally issued. Companies that are already showing signs of cash flow stress, as reflected in the recent increase in payment-in-kind (PIK) lending, may struggle to service refinanced debt at higher rates, which increases default risk across the private credit ecosystem. Investors who have been using private credit as a substitute for public fixed income should consider whether that allocation provides the liquidity, transparency, and risk reduction they actually need in a more volatile rate environment.
What should investors consider as the Fed shifts from rate cuts to potential rate hikes?
When the rate environment shifts from a cutting cycle to a hiking cycle, as current CME FedWatch pricing suggests may occur by December 2026, the implications across asset classes are broad. Fixed income investors may want to review portfolio duration and credit quality, since longer-duration bonds and lower-credit-quality issues typically face the most headwinds in rising-rate environments. Equity investors may want to consider how tighter monetary conditions historically affect earnings multiples, particularly at today’s elevated valuations. And investors using private credit as a diversifier may want to evaluate whether that allocation provides genuine risk reduction or simply shifts the type of risk they are carrying. The key, based on my experience managing portfolios through multiple rate cycles, is not to abandon any asset class but to be more intentional and flexible about how each is implemented within a broader strategy.
