This Time is Different. Or is it?
By Todd Stankiewicz | CIO, SYKON Capital | Portfolio Manager, Free Markets ETF (FMKT)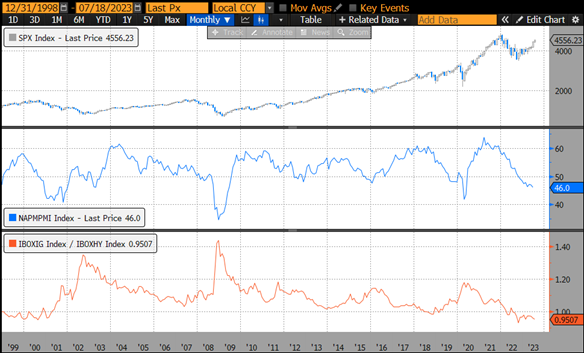
Source: Bloomberg IBOXIG - iBoxx Investment Grade Bond Index; IBOXHY - iBoxx High Yield Bonds Index; SPX - S&P 500 Index; NAPMPMI - ISM Manufacturing PMI SA
This past Monday market participants piled into eight new leveraged loan deals and four junk bond sales, with two of these deals raising over $1 billion dollars each. This is occurring as the effective yield on single B high yield bonds has dropped to levels we have not seen since February of 2023. The yields have fallen from 8.86% to 8.4% just since July 6.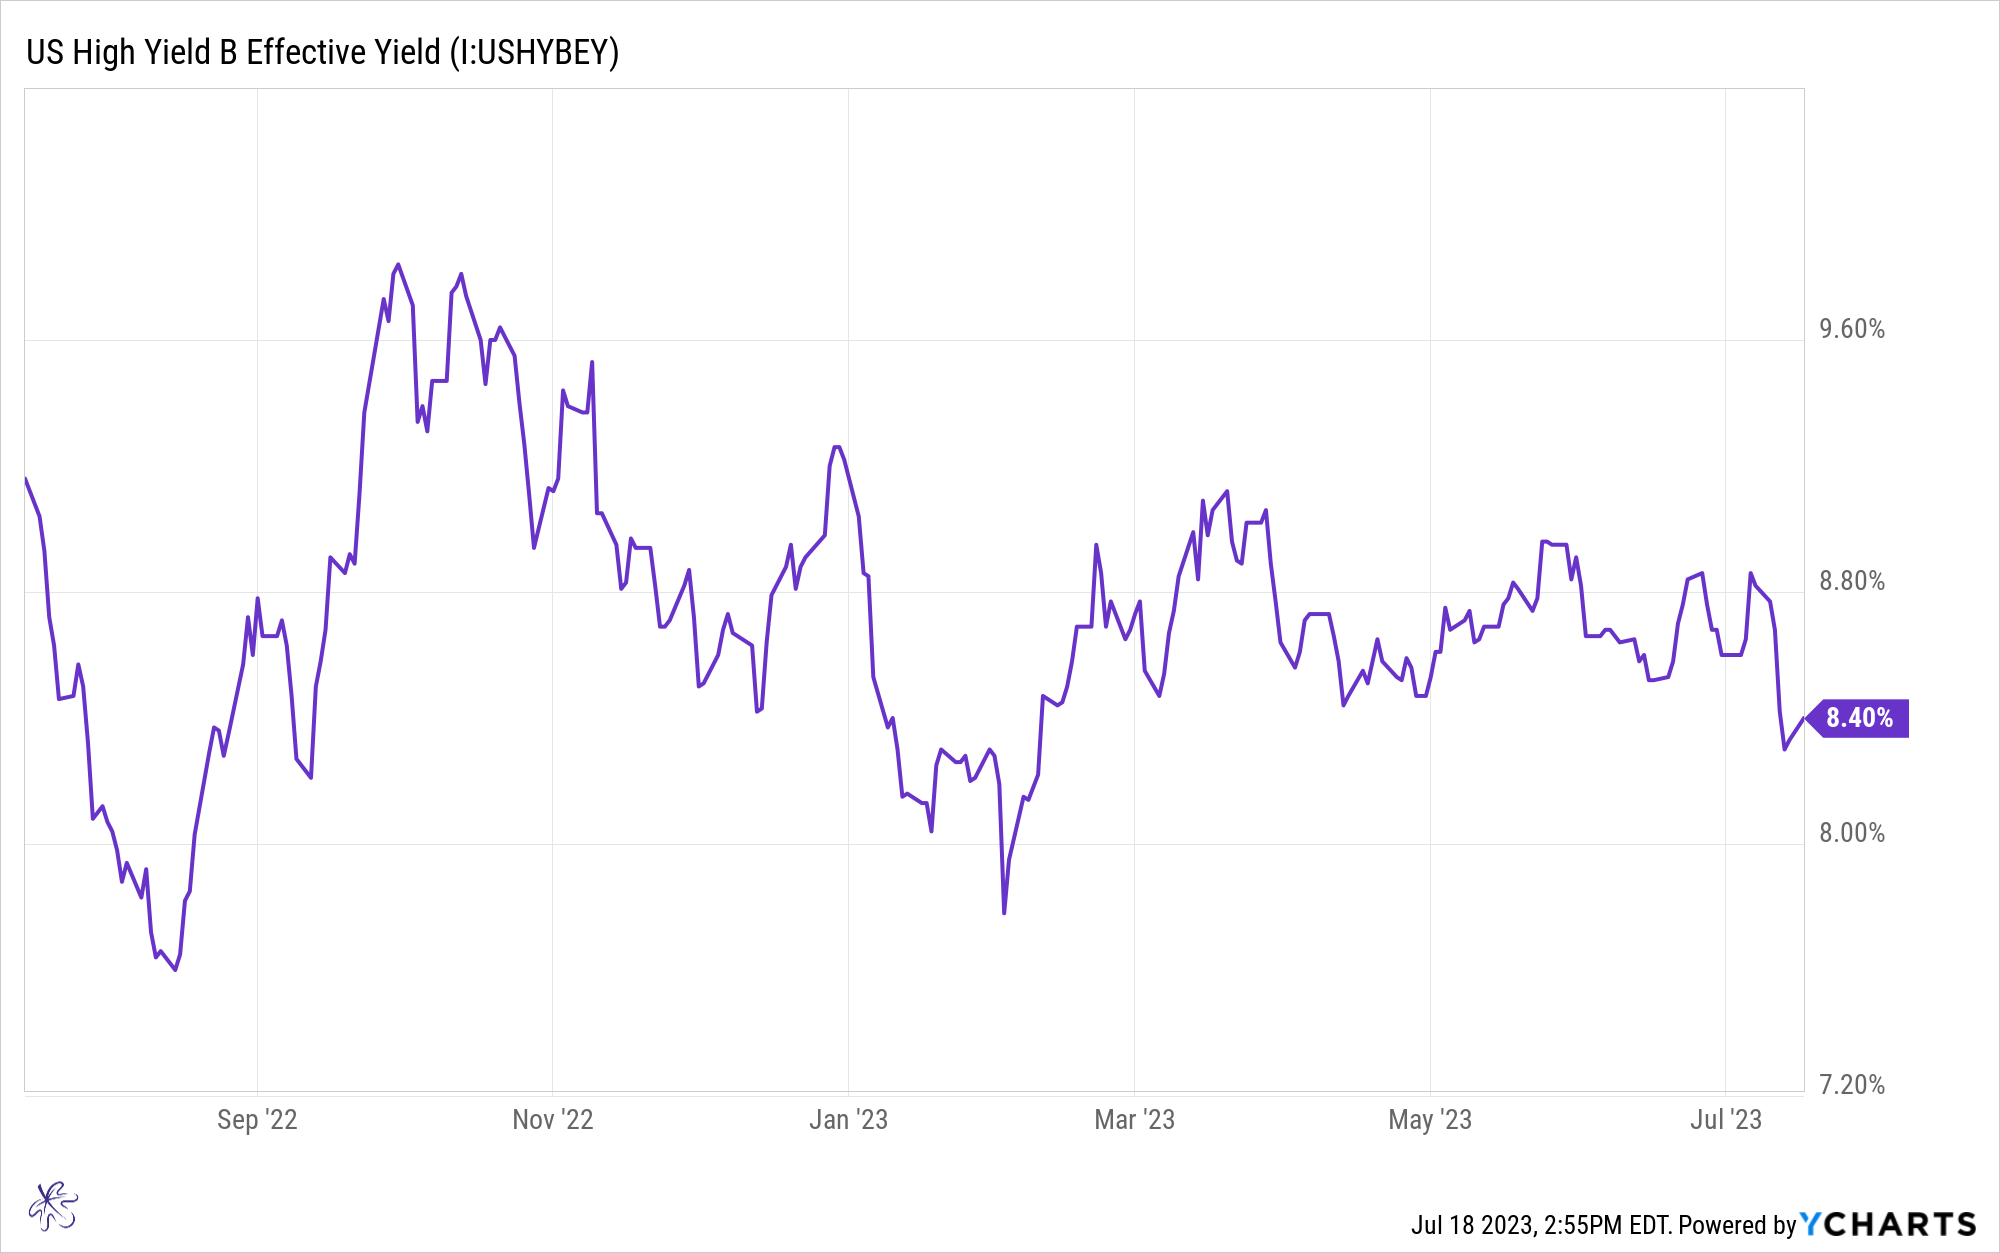
Simultaneously, investors are chasing individual equities, with the IIAA individual stock allocation reaching the highest levels since May of 2017. Today, the AAII investors sentiment jumped to 51.4% bulls vs only 21.5% bears. This represents a 29.9% spread between the bulls and bears. Bull sentiment has not been this high in over 2 years. Put/Call ratios are at their lowest levels in the past couple of years and consumer sentiment is at the highest levels since October of 2021. 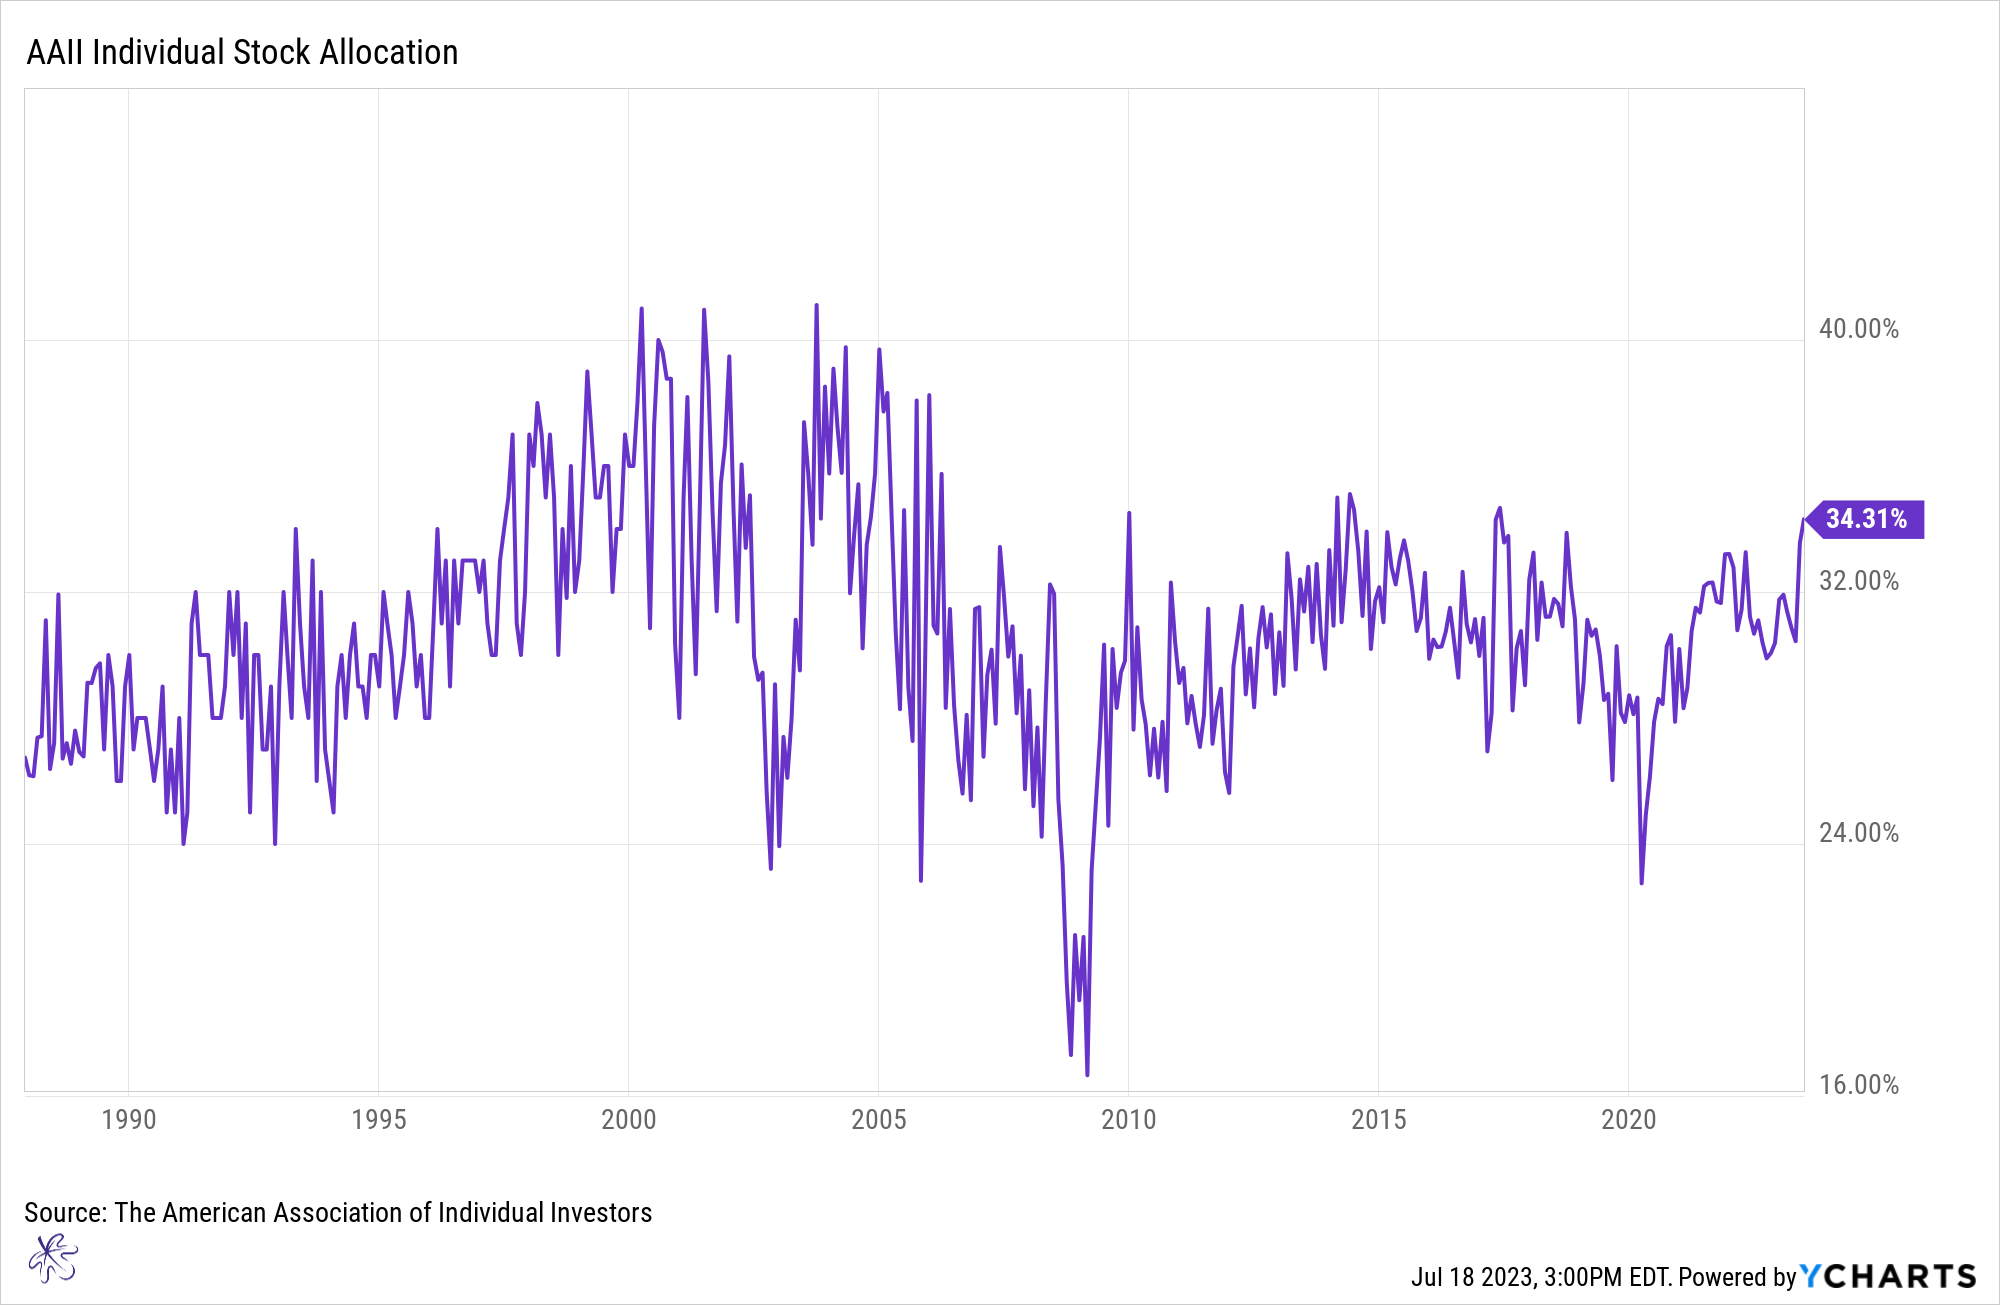
As issuers have pushed out deals, investors are clamoring for allocations. Clearly the market is thinking that this time might be different, and investors are betting on a soft landing by the Fed, despite recession probabilities being at 40-year highs.
When we examine the ratio of investment grade bonds to high yield bonds, the market is in a full risk on mode. In fact, the ratio of investment grade bonds to high yield bonds is at one of the lowest levels in the past 25 years. The lone exception is October of 2022, which occurred because the FOMC set out on one of the most aggressive rate hike campaigns in history. These rate hikes resulted in the investment grade index declining more than the high yield index due to the higher interest rate sensitivity of investment grade bonds.
The low levels in this ratio mean that high yield bonds have substantially outperformed investment grade bonds. When we have reached extreme lows in the past, it is often followed by a reversal in the trend. Ultimately, investment grade bonds should outperform high yield bonds as this ratio resets from extreme levels. In the past, these resets have also been associated with increased volatility in the S&P500 Index, with some of those drawdowns being substantial.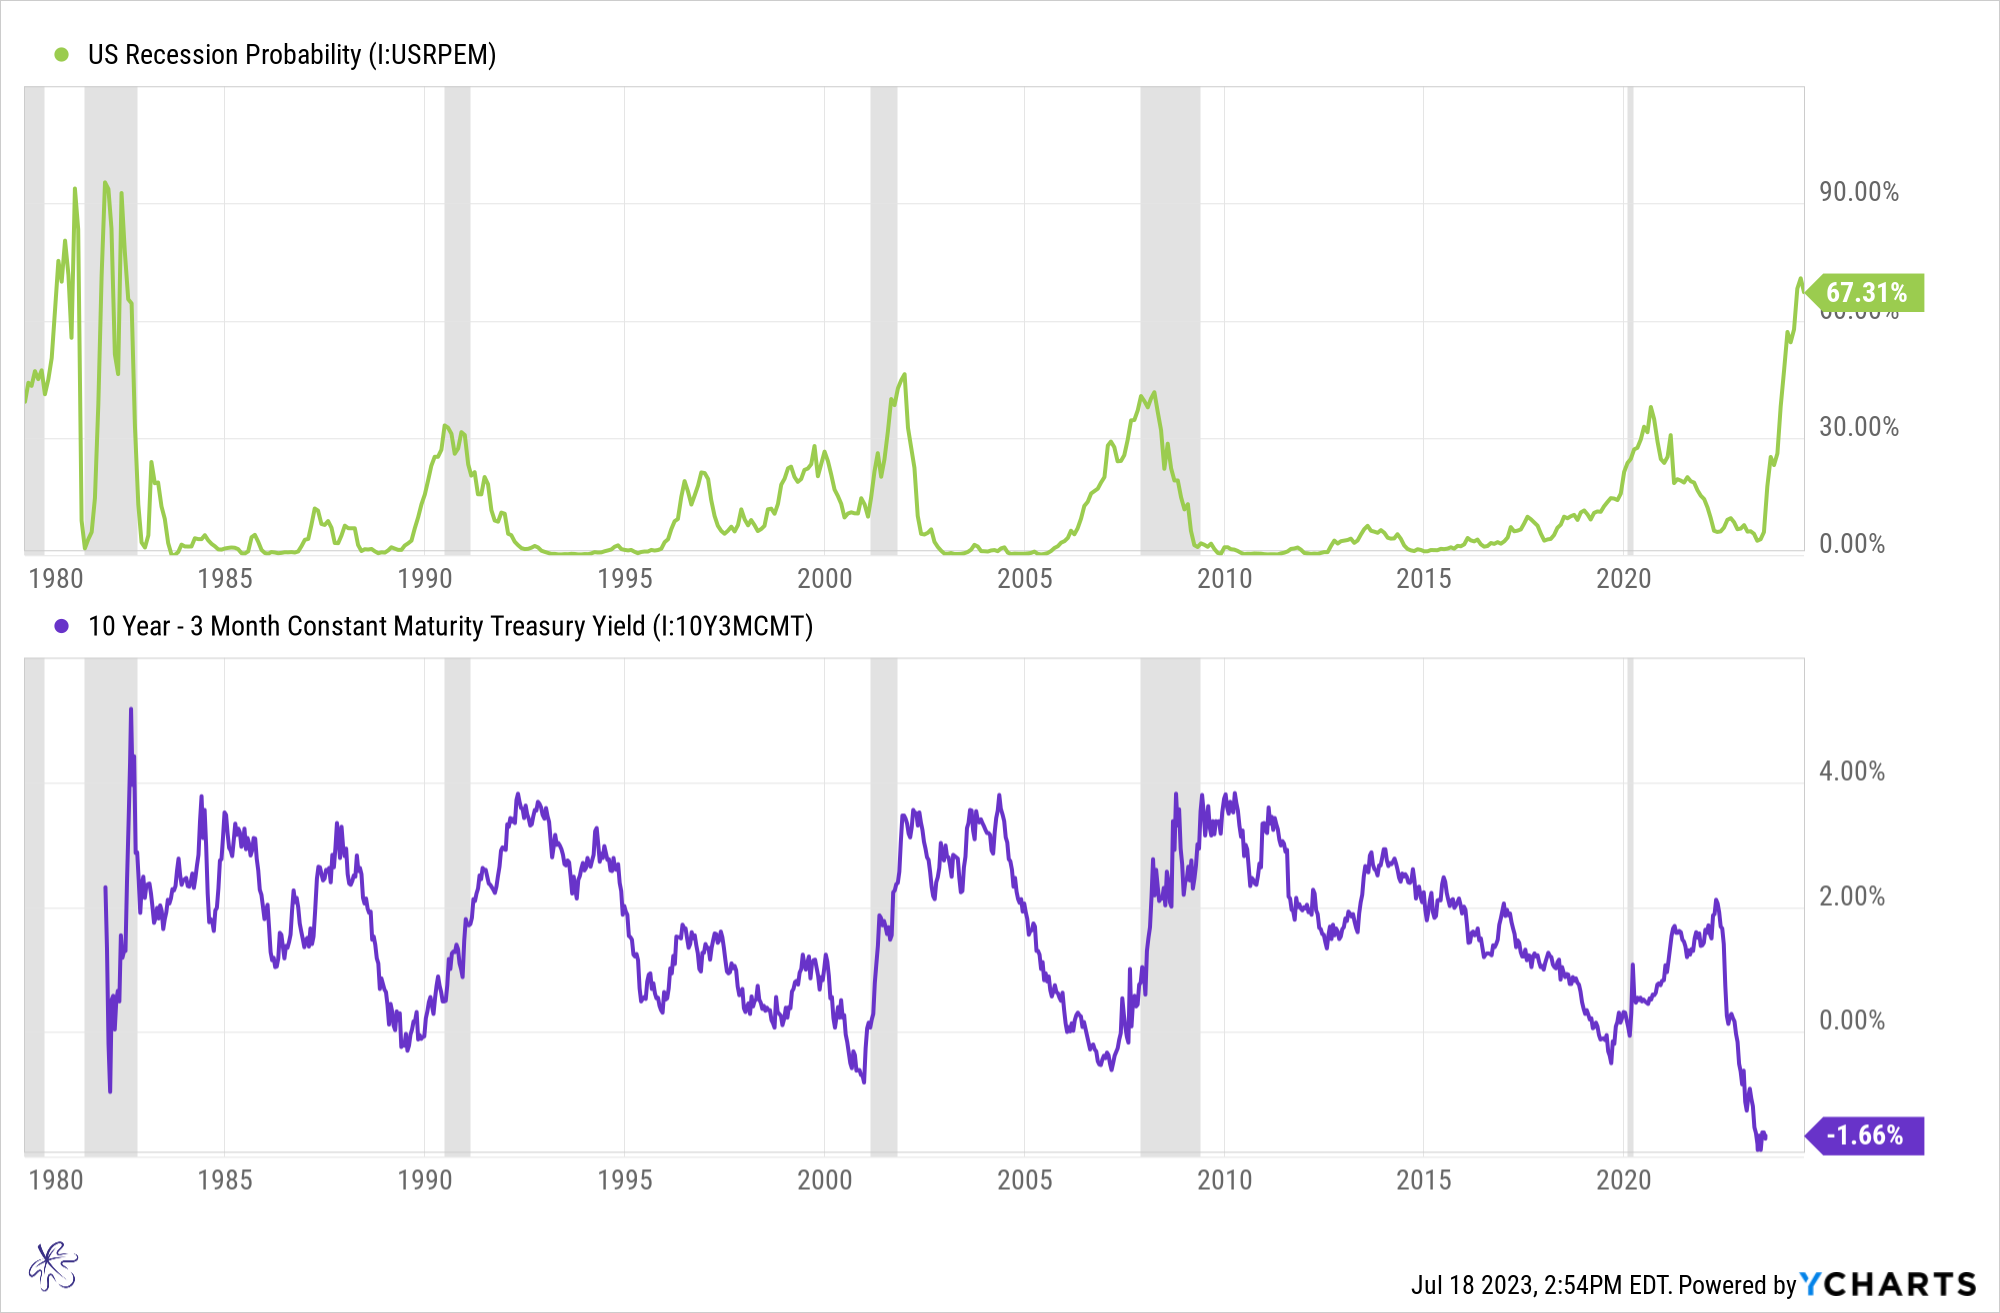
It seems that market participants everywhere are searching for reasons to declare that that this time is different, from softening economic data to a Fed pause, arguing that the path toward a soft landing appears less fraught with uncertainty than even just 4 months ago. This has analysts across the street rapidly lowering recession probabilities, despite the 10 year minus 3 month yield curve inversion remaining at close to all-time highs, signaling recession probabilities at 40 year highs.
Is this time actually any different?
When we incorporate ISM Manufacturing PMI, one of the major leading economic indicators, we see it is currently indicating contraction with a reading below 50. Previous periods where the PMI was declining and dropped below the 50 level, were followed by spikes in the investment grade to high yield ratio. This is an indication of market preferences for higher quality, lower risk assets.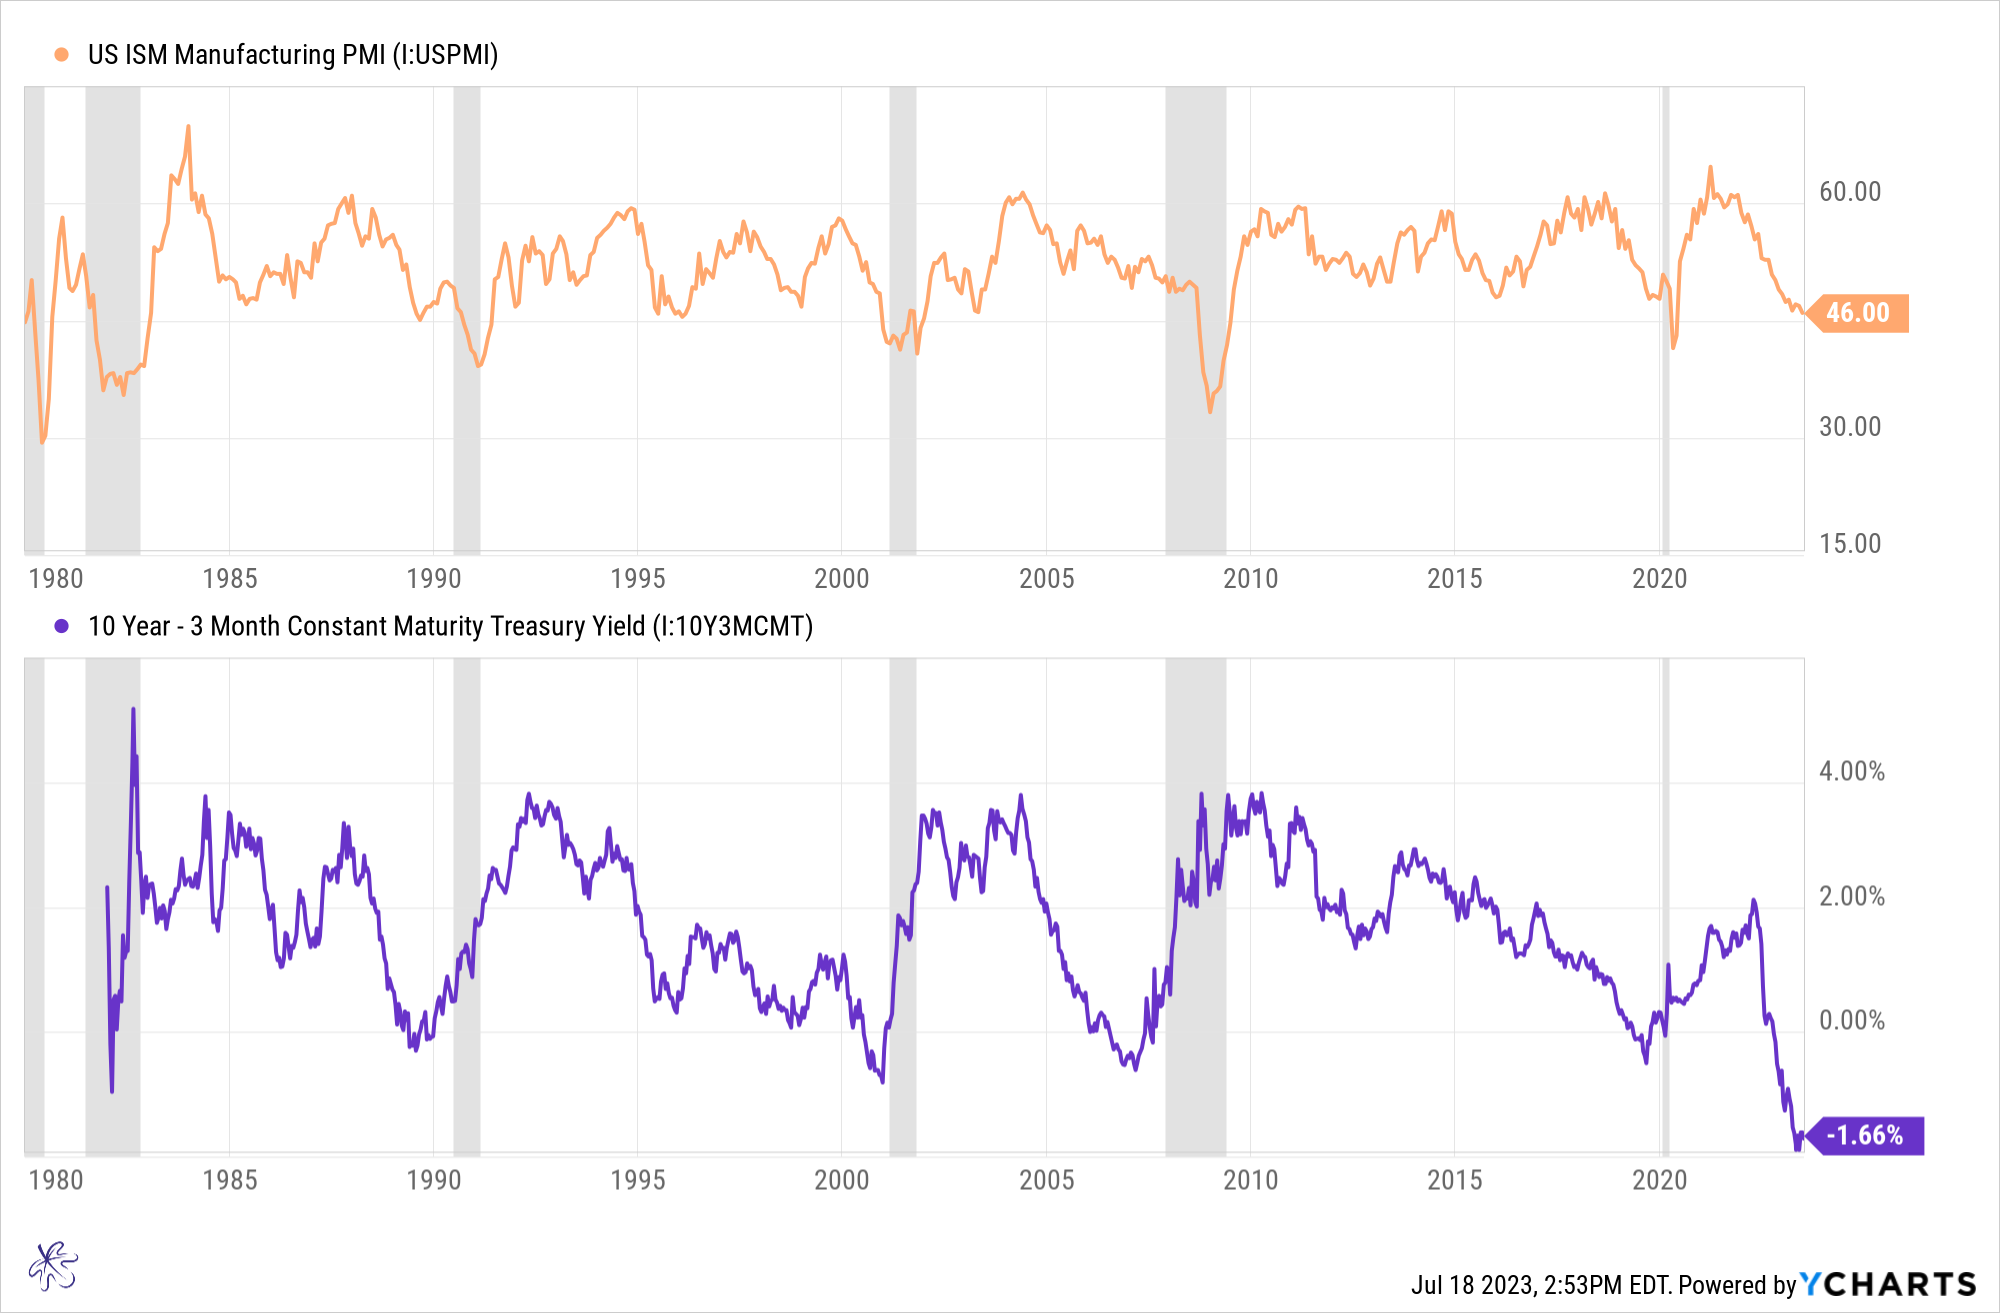
Going back to the question, is this time really different?
Maybe it is. We hope that it is. No one wants to see a recession, but unfortunately that may not be the case.
Looking back at data from the 1980’s, we can see that the 10yr minus 3-month yield curve inversion tends to lead US ISM PMI weakening and contraction, which is highly correlated to economic recessions.
As the PMI weakens, the ratio of investment grade to high yield bonds typically rises from low points, with a return of equity volatility being the final domino to fall. So, while many investors a piling into high yield and other risk-based assets, the opportunity going forward may favor Investment Grade and other lower risk assets.
We hope that this time is different but fear it may be another case of history rhyming. Markets can stay irrational for long periods, so there may still be opportunities for continued upside in risk assets. The key is to stay disciplined and proceed with caution.
