Uranium’s Technical Setup: Riding the Upper Bollinger Band
By Todd Stankiewicz | CIO, SYKON Capital | Portfolio Manager, Free Markets ETF (FMKT)
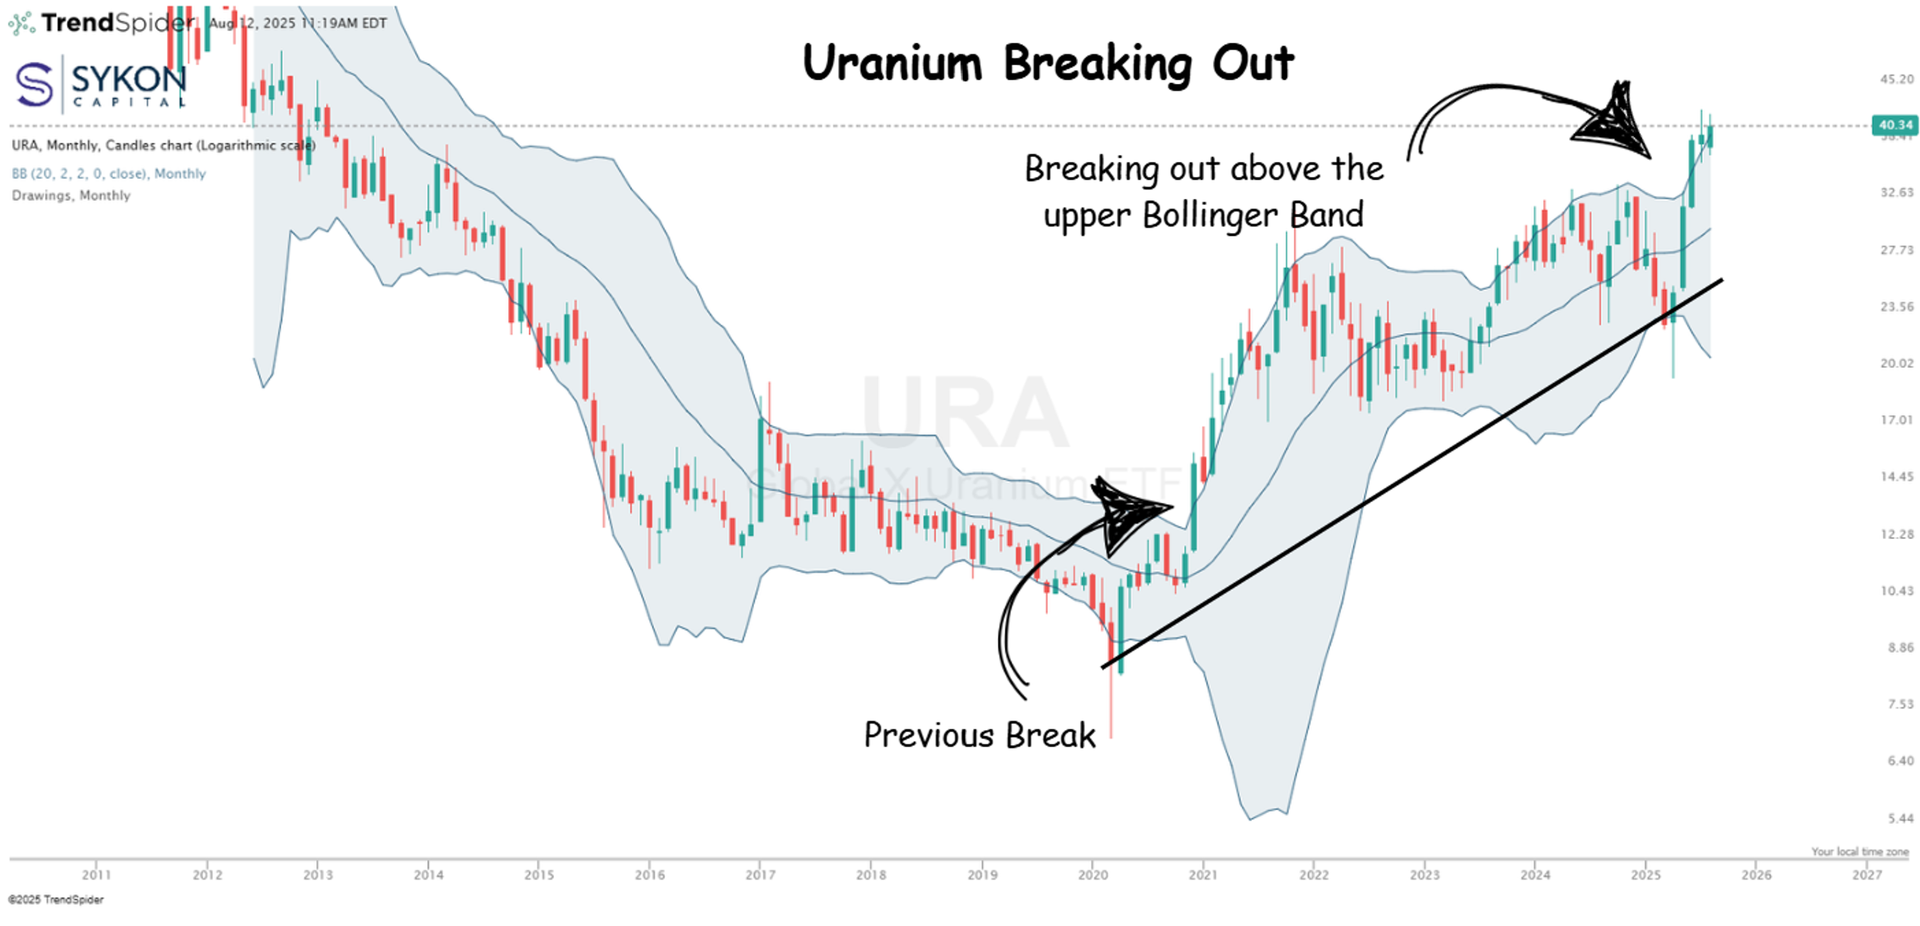
Back in June, I highlighted uranium’s breakout above the upper Bollinger Band as an early sign of sector strength. Since then, the move hasn’t faded, uranium continues to ride that upper band, showing strong, persistent momentum. The Global X Uranium ETF (URA) is leading the charge, supported by recent executive actions promoting deregulation in nuclear energy and what some are calling a “nuclear renaissance.”
This setup is similar to 2020, when uranium broke above its upper band and stayed there for almost a year. Back then, URA moved from about $12 to $26 a share, marking a significant rally. Today’s move could be the start of another leg higher.
Trend Continuation Potential
- Momentum: Three consecutive monthly green candles (June–August 2025), each larger than the last. Breakout cleared the 2023–2024 range with volume supporting the move.
- Structure: A multi-year base from 2016–2020 preceded the 2020–2021 surge from $8.69 to $26.86 (209% gain). The current breakout has similar traits.
- Bollinger Bands: Widening bands suggest the trend is strengthening, with no clear bearish divergences. Monthly candles have minimal upper wicks, signaling conviction.
Key Considerations
- Risk Management: URA’s rapid move from $25 to over $40 could prompt healthy consolidation. A monthly close below $32.50 would be the first warning sign.
- Targets: Historical price action points to $50–$55 as a realistic upside zone if fundamentals stay supportive.
- Long-Term: Despite the rally, URA remains well below its 2011 highs. The 2016–2020 base provides a strong foundation for further gains.
Bottom Line
Uranium’s technical picture remains bullish. Riding the upper Bollinger Band like this is positive and, historically, has preceded extended rallies. While short-term pauses are likely after such a sharp move, momentum and sector fundamentals suggest the trend could carry significantly higher, as long as key support levels hold.
