What clues do high yield credit spreads provide?
By Todd Stankiewicz | CIO, SYKON Capital | Portfolio Manager, Free Markets ETF (FMKT)
High yield credit spreads are tight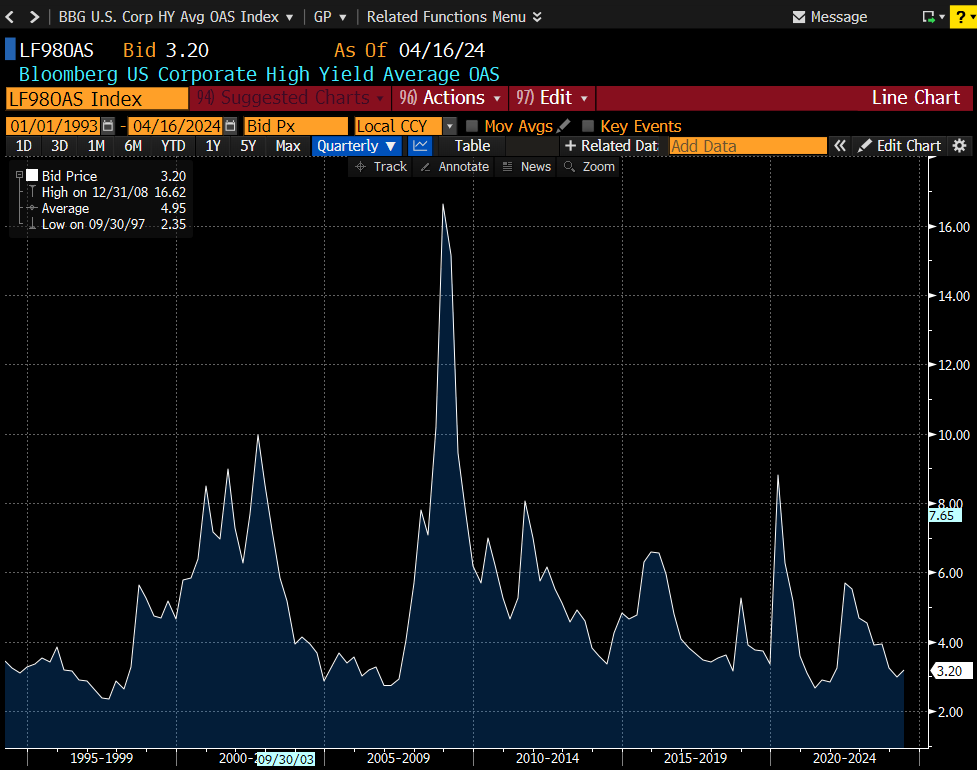
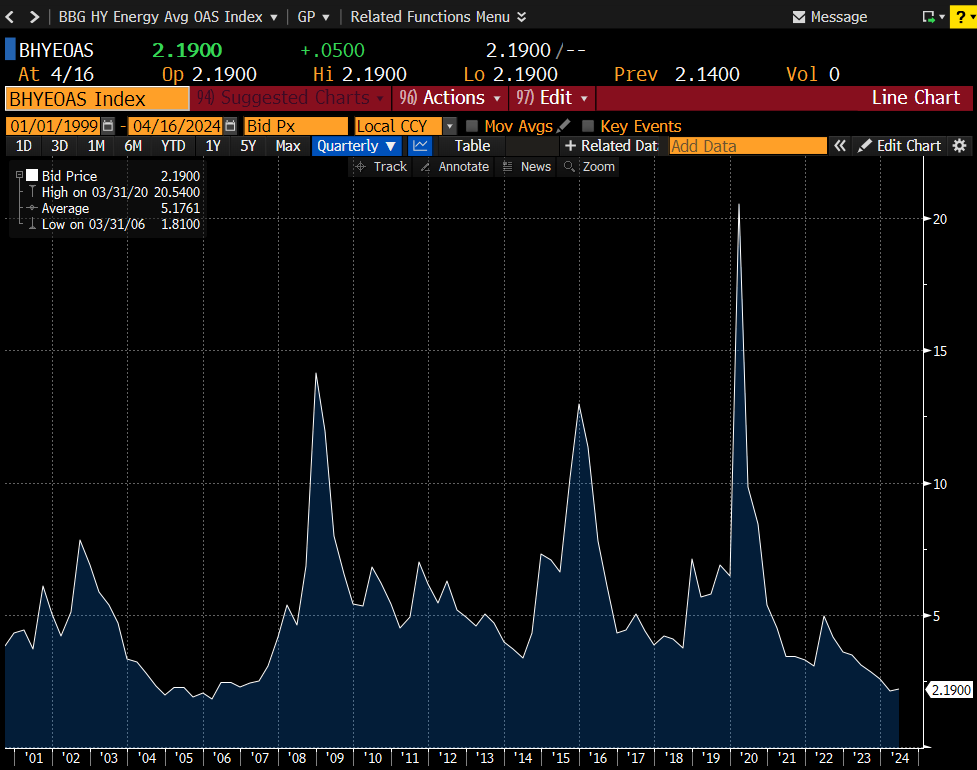
Source: Bloomberg
High yield credit spreads are very tight. This indicates that high yield bonds are not receiving a lot of extra yield as compared to treasury bonds. The top chart represents the Bloomberg US Corporate High Yield Average Options Adjusted Spread (OAS) and the bottom charts represents High Yield Energy Average OAS. It has become so extreme that the High yield market in general is trading at some of the lowest levels in the past 30 years.
The High Yield Energy OAS is at the lowest level since 2005. These low levels suggest that the market is not fully pricing in risk. From a portfolio perspective, it may make sense to rotate up to high quality bonds. Based on historical patterns, it is unlikely these OAS move lower from here. The bigger risk is that they widen, which may cause the price of high yield bond prices to decline if interest rates remain stable.
Inlfation Expectations are on the rise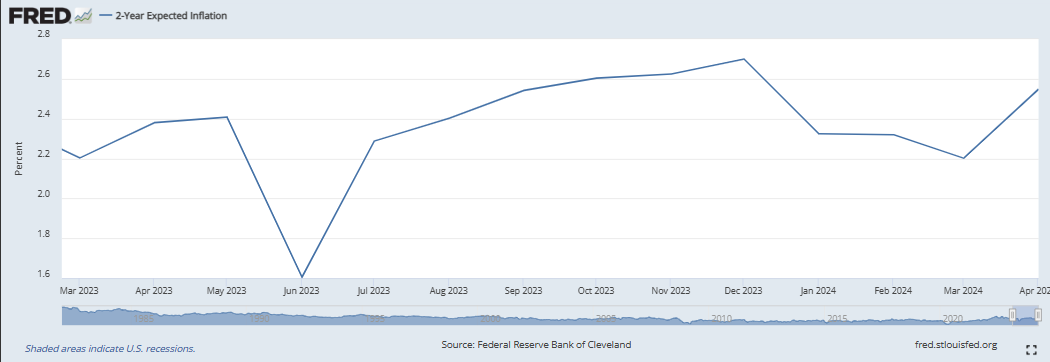
Two-year break-even inflation expectation have jumped from 2.2% in March to 2.55% in April. This rapid rise in inflation expectation is potentially contributing to the increase in market volatility.
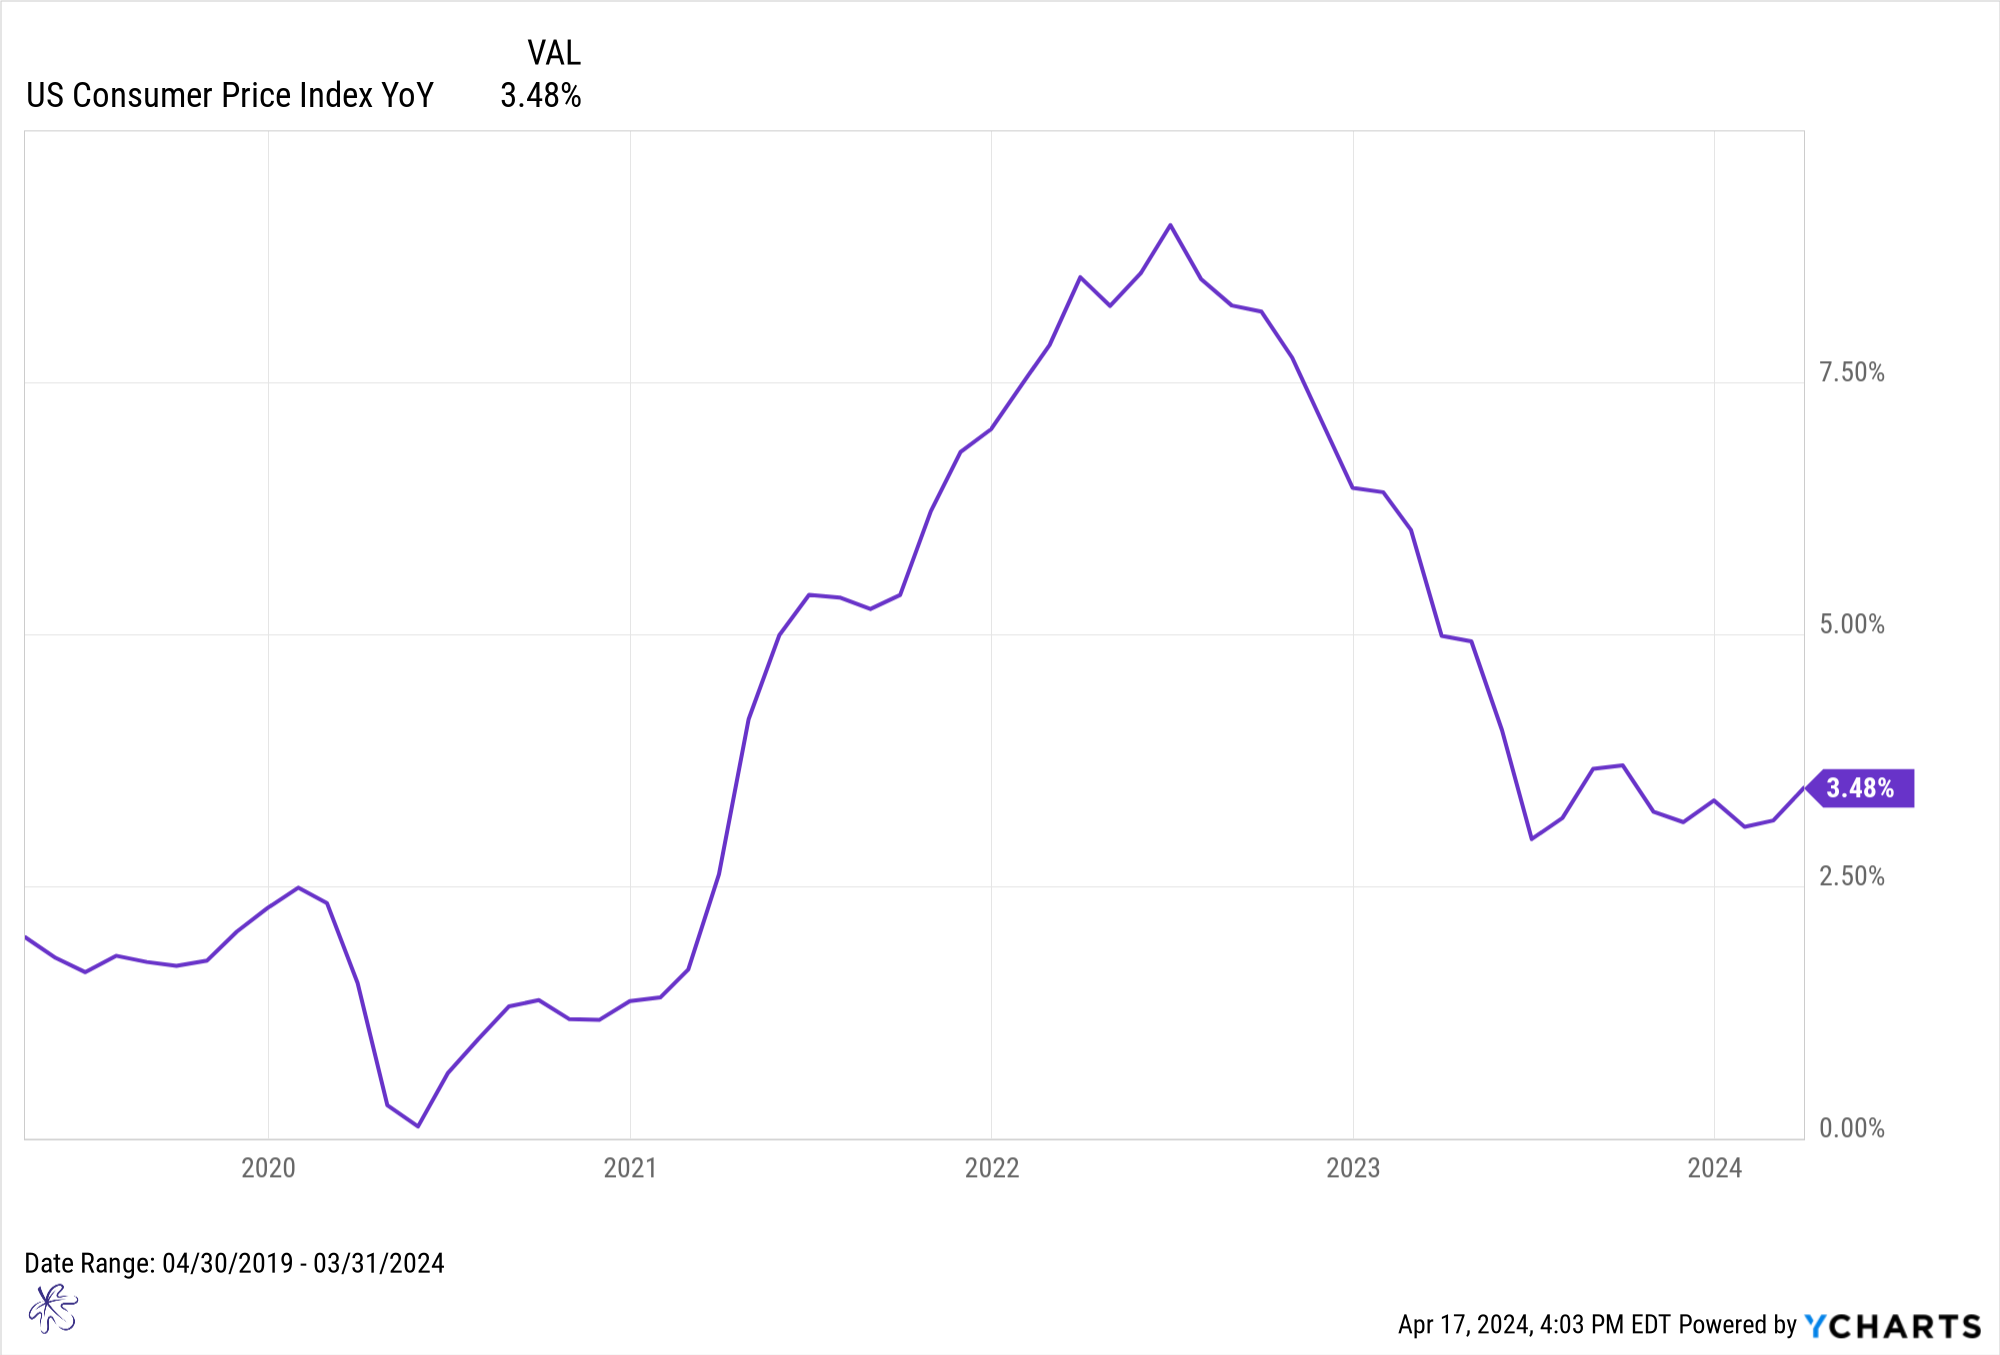
The YoY Consumer Price index change (inflation) is still at 3.48%. The move to an inflation level of 2.55% represents a significant drop from the current levels we are at today. The reality is that if inflation levels remain at or above the levels we are at today, it is unlikely the FOMC can cut rates. If the 2-year break even rates are to adjust higher, it could continue to introduce volatility into the market. If this gap narrows, it could be a reason to be more constructive on equities.
Gowth vs Value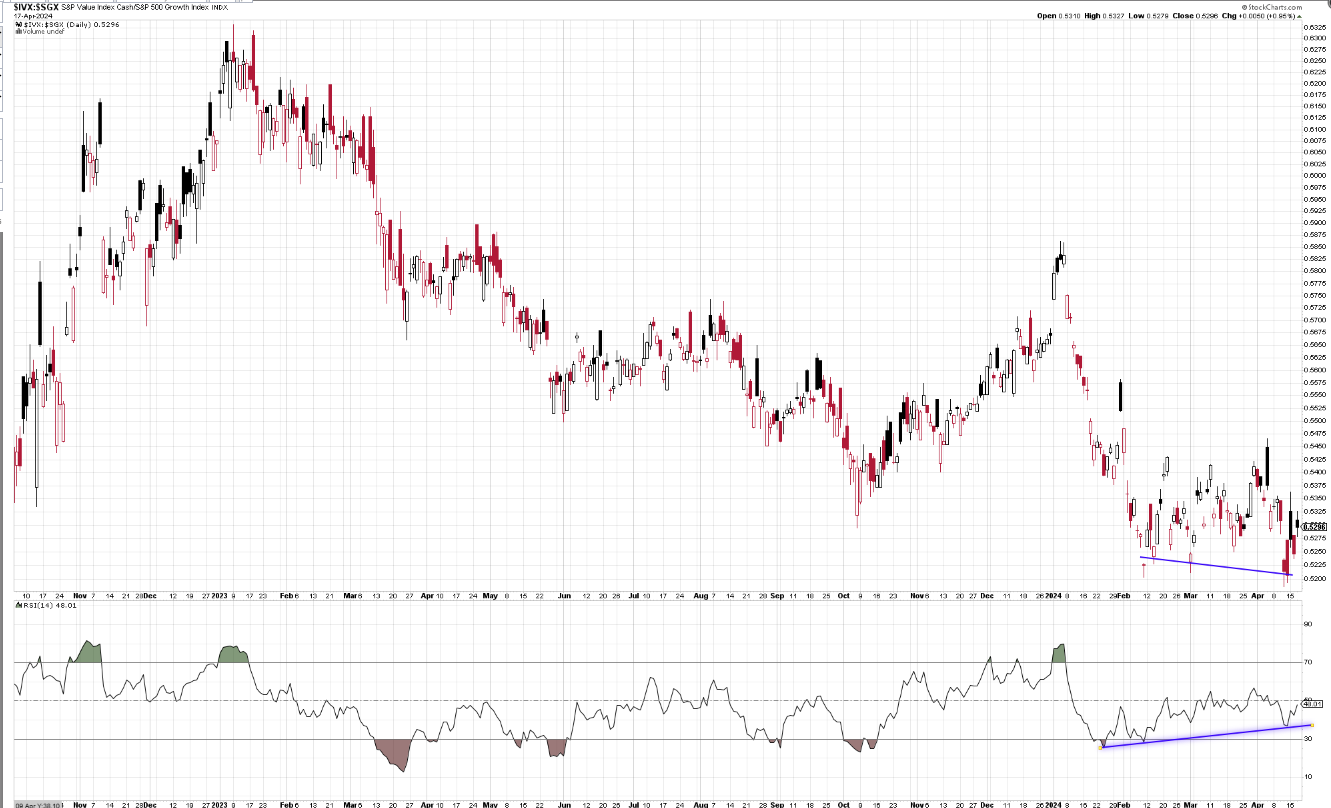
Sources: Stockcharts.com
The S&P500 value index may be bottoming on a relative basis to the S&P500 growth index. This ratio chart plots each of the respective indices relative to each other. When the chart is moving lower, growth is leading value. In this case, the ratio chart has been making new lows, while the RSI is making higher lows. This is a typical bullish divergence, indicating that value may soon be leading growth on a relative basis.
