What goes up……must go up even more?!?
By Todd Stankiewicz | CIO, SYKON Capital | Portfolio Manager, Free Markets ETF (FMKT)
Has the Dow Jones Industrial Average gotten so overbought that it is actually a positive indicator for forward returns?
Last Friday, the Dow closed with an RSI over 85, something we have not seen since 2018 and have rarely seen in the last hundred years. Overall, this has happened 26 times since 1920, but many times it is clustered with several observations occurring within several days. If we consolidate those clusters into one observation, last Friday is only the 10th time this has happened since 1920.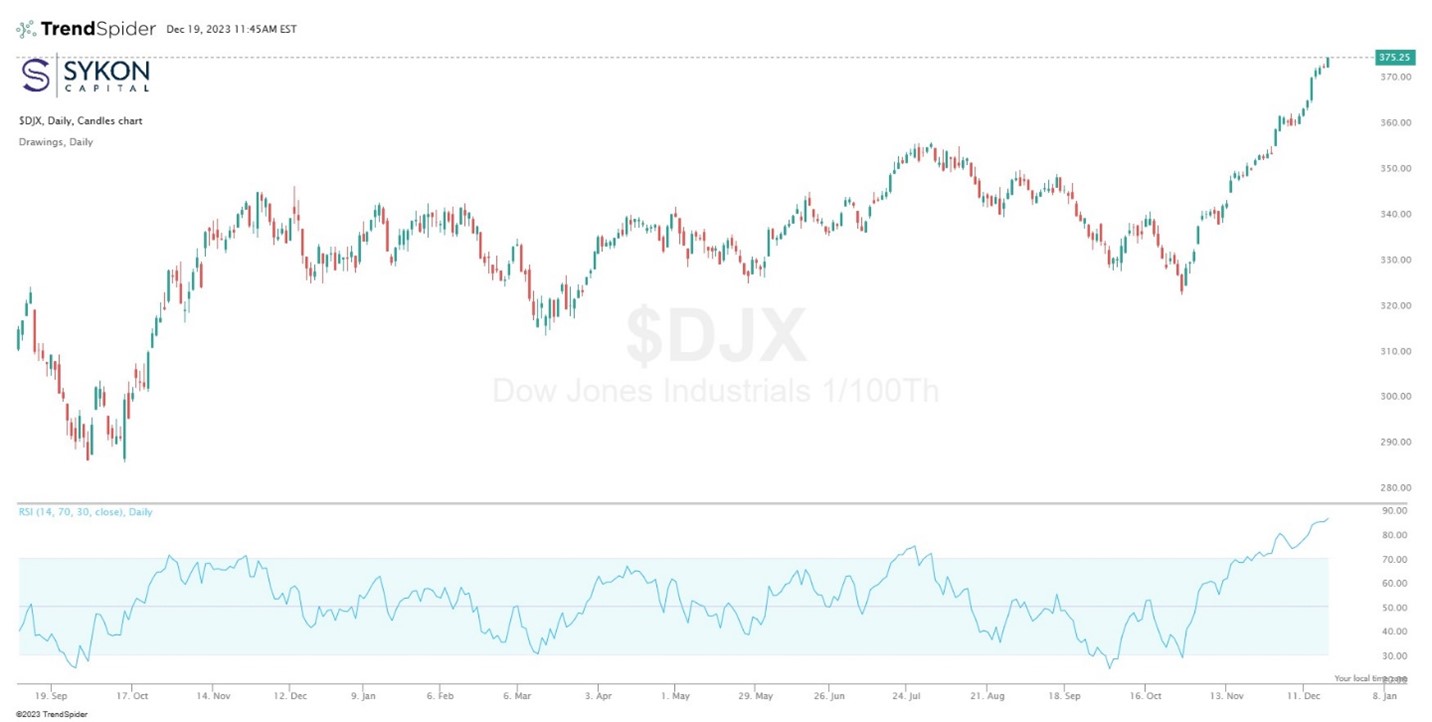
The Relative Strength Index or RSI is typically considered overbought with any reading above 70 and can usually signal short term tops in the market. In fact, the two most recent overbought conditions – hitting 75 in July of this year and 71 in the fall of 2022 – were both met with meaningful pull backs in the market.
The last time the DJIA exceeded an RSI of 85 was January of 2018, hitting a peak of 88.69 on January 26, 2018. The Dow closed at 26,616.71 that day, a level it did not exceed again until nearly nine months later, on September 20, 2018.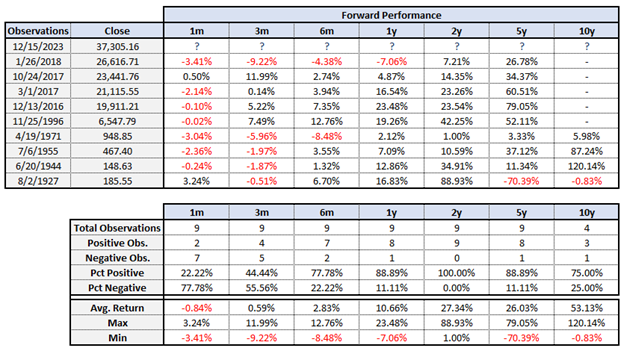
Source: Bloomberg Inc; SYKON Capital, LLC
Disclaimer: Return information is calculated based upon prices only and is not reflective of total return data, as it does not account for dividends due to a lack of historical data.
Since January 1920, the RSI on the DJIA has only exceeded 85 on 0.10% of observations, or 27 occurrences in 26,218 observations. As we mentioned earlier, these periods tend to cluster, so if we once again count those periods with multiple observations in the same month as a single instance, this drops to only 10 occurrences or 0.038% of the time. This is a staggeringly small number.
Okay, so we get the point – this is incredibly abnormal – but what exactly does it mean for the future when an extraordinarily rare overbought condition occurs?
Using history as a guide, we can see that this signal will likely present a short-term top to the market, as the Dow has declined more than half of the time in both the 1- and 3-month periods following an RSI reading of 85 or greater. Expanding that range further, we can see that all other observation periods – 6-month, 1-year, 2-year, 5-year, and 10-year – have all had seen positive performance more than 75% of the time.
Moreover, the only observation period that has seen a negative average return is the 1-month timeframe. All others have seen positive average returns, often with max returns that far outpaced the minimum returns – with the lone exception being the 5-year period, which owes that distinction to the 70.39% decline from August 2nd, 1927, to August 1st, 1932, representing the journey from the excesses of the Roaring 20s into the depths of the Great Depression. These figures convey a picture that this extreme level in the RSI can possibly represent opportunity for the Dow moving forward.
In fact, there are 40 calculation periods across the 6-month, 1-year, 2-year, 5-year, and 10-year timeframes, and only 5 of them are negative. So if history is any guide, there could be serious potential for positive returns in the future, though there will likely be some turbulence in the short run.
As always, it will be important to remain flexible and dynamic with respect to your asset allocation, and to use data and a defined process to remain unemotional and unbiased in the face of the irrational greed and fear in the market.
