What Might Seasonality Tell Us about the Markets?
By Todd Stankiewicz | CIO, SYKON Capital | Portfolio Manager, Free Markets ETF (FMKT)
In a financial world marked by ever-evolving dynamics, our exploration of market seasonality has illuminated intriguing trends and shifting patterns. While November shines as a beacon of strength for the S&P 500 index, the 10-year Treasury yield's relationship with seasonality introduces an element of unpredictability.
Join us as we navigate the intricate dynamic between tradition and transformation in the world of investments. Discover how historical insights merge with contemporary market realities, and why adaptability is the cornerstone of effective wealth management and investment strategy in today's dynamic financial landscape.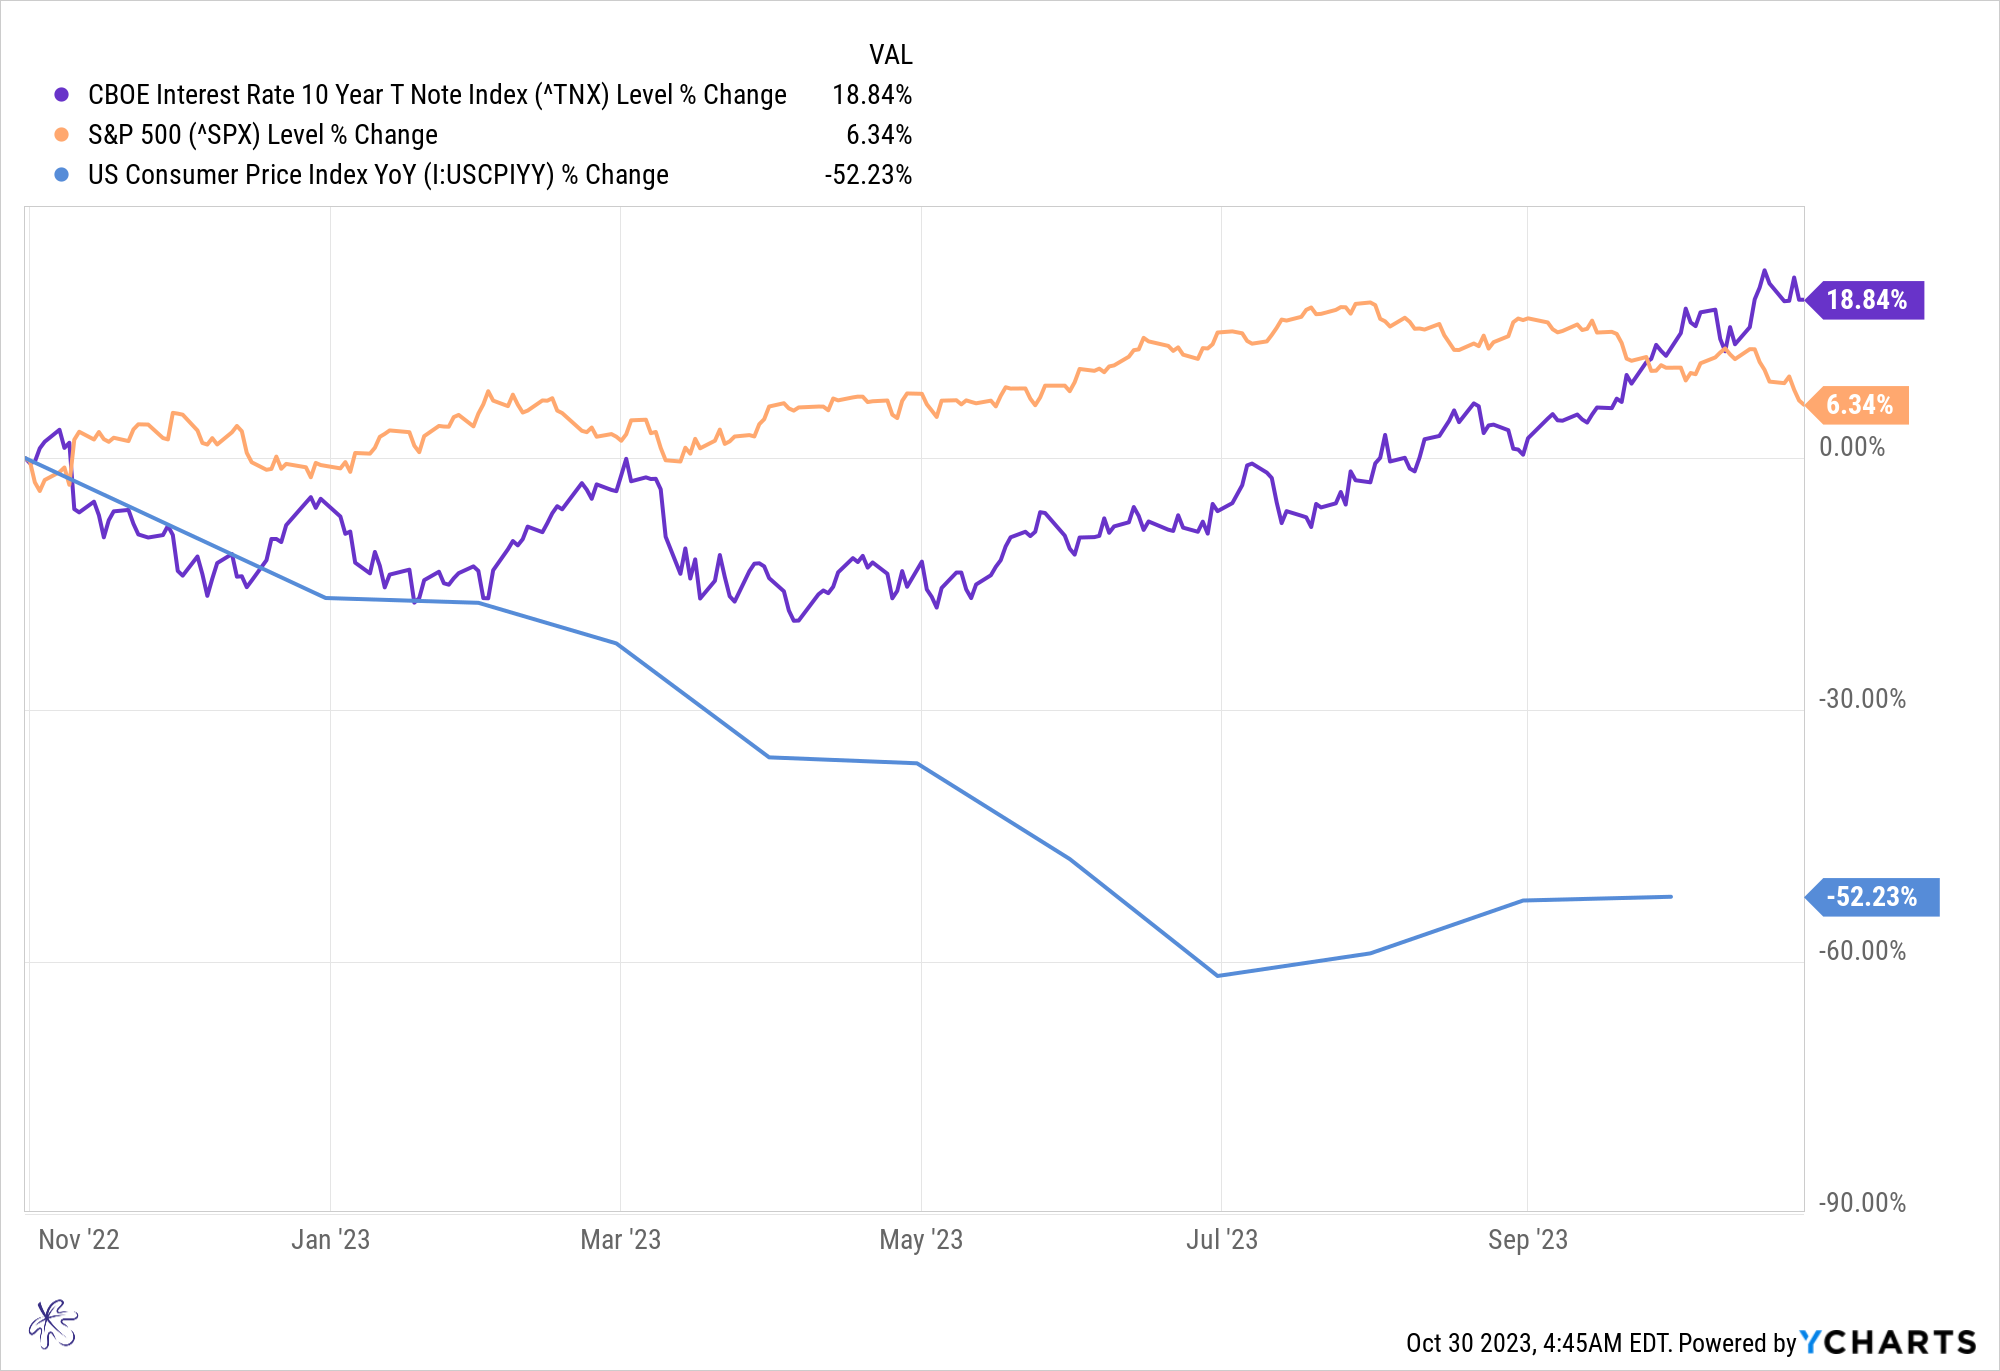
Over the past year, a remarkable interplay has emerged between the equity markets, interest rates, and the year-over-year change in the U.S. Consumer Price Index (CPI). Traditionally, the fourth quarter of the equity markets has earned the festive moniker of the "Santa Claus Rally." Yet, given the stark reality of the Federal Open Market Committee (FOMC) still grappling with the highest inflation rates witnessed in over a decade, one might question whether seasonality still imparts the insights we've come to expect.
The chart above illustrates this intriguing dynamic, with the orange line denoting the S&P 500 Index, the purple line signifying the yield of the 10-year Treasury, and the blue line tracking the year-on-year rate of change in CPI.
In the final quarter of 2022, the markets surged, while interest rates held steady, buoyed by hopes that CPI had peaked. As we ventured into 2023, narrow components of the equity markets sustained this upward momentum, even in the face of rising rates, driven by optimism that the FOMC might contemplate a shift toward looser monetary policy in response to softening inflation, as indicated by the CPI. Contrary to market expectations, CPI took an unexpected turn, embarking on an upward path, which in turn, prompted a spike in bond market rates. This abrupt shift in dynamics burst the bubble of hope within the equity markets, emerging as one of the potential catalysts behind the recent market sell-off.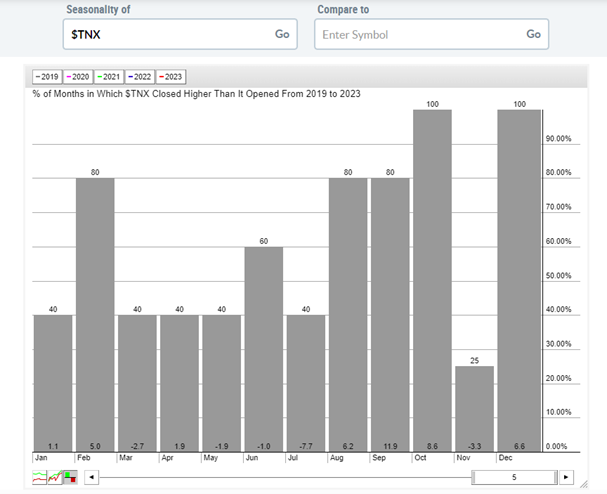
StockCharts.com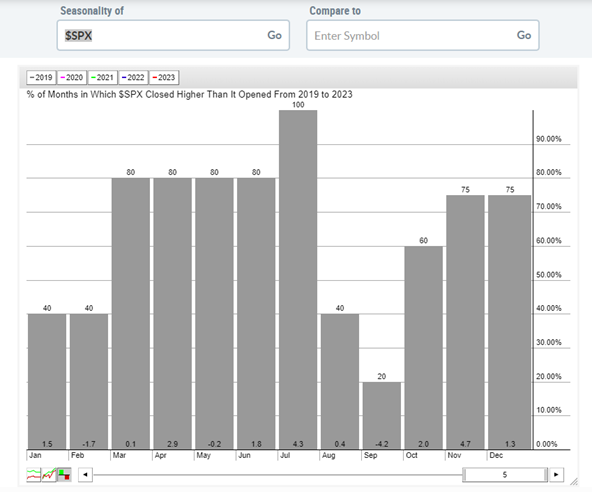
StockCharts.com
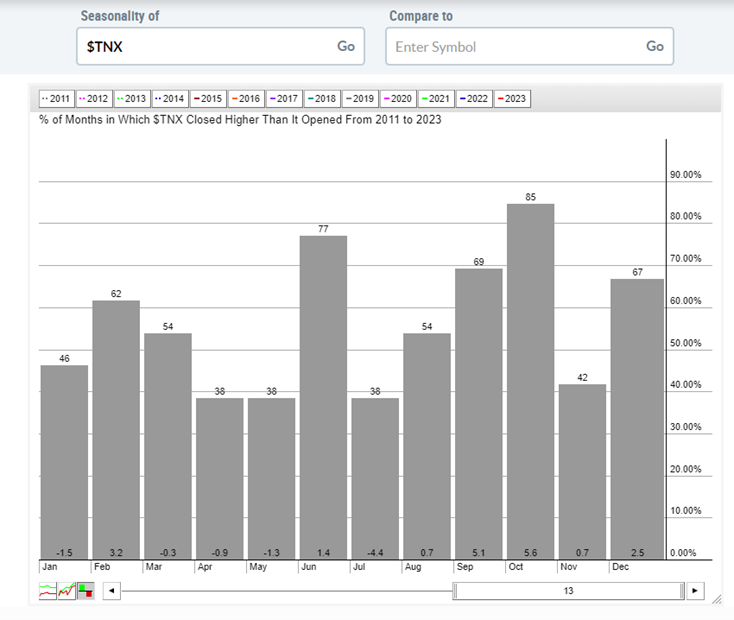
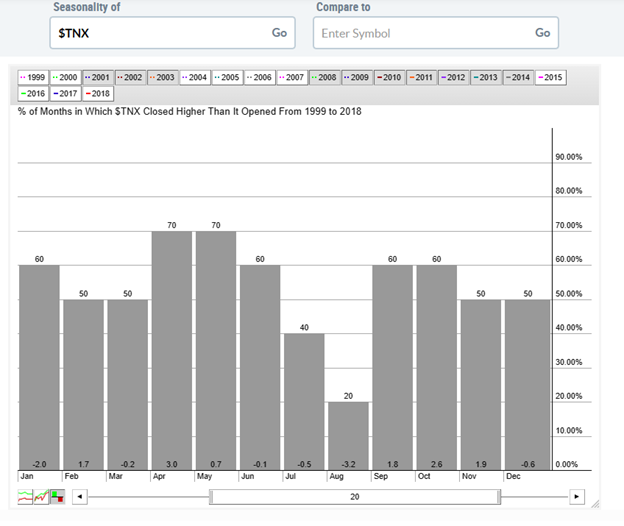
When we examine the seasonality of the 10-year Treasury yield and the S&P 500 index over the past five years, several noteworthy patterns emerge. November has witnessed higher 10-year treasury yields only 25% of the time, but in December, it has consistently seen higher yields in all instances. As we embark on a new year, there is a notable trend favoring lower bond yields and interest rates during November.
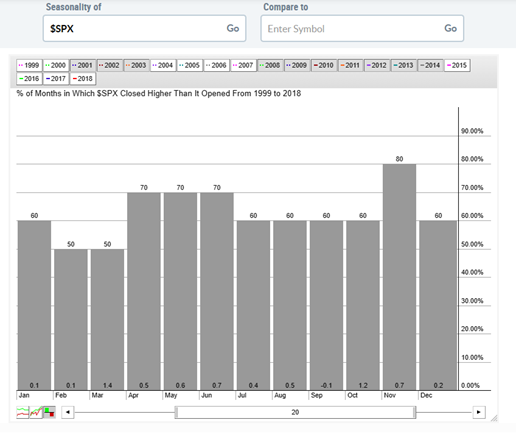
Turning our attention to the S&P 500, the recent three-month period spanning August, September, and October has emerged as one of the weakest stretches for the index. In contrast, historical data indicates that November and December tend to be robust months for the S&P 500. However, January and February have shown a more mixed performance, making them less predictable in terms of market strength. These observations shed light on the cyclical patterns that investors navigate within these specific timeframes.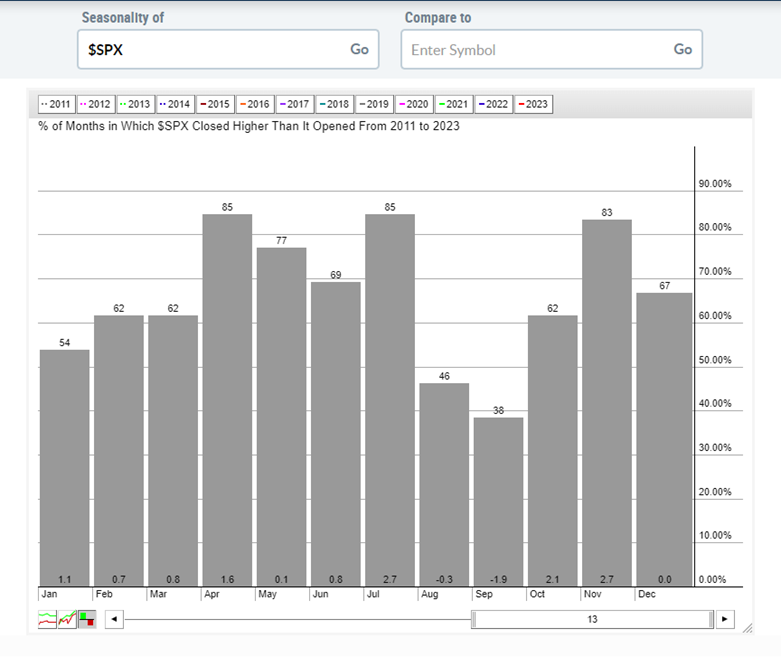
StockCharts.com
Zooming out to consider the broader modern history since the Great Financial Crisis, we believe we can gain a deeper understanding of seasonal trends. Although November remains one of the historically stronger months, the data surrounding December starts to show signs of diminishing returns. Over the past 13 years, the average return for the S&P 500 index during December has hovered around 0.0%. This suggests a shifting landscape in traditional seasonality trends. Rather than adhering to the old adage of "sell in May and go away," it now appears that adopting a strategy of buying in March and selling in July may align better with the evolving seasonality profiles observed over both the trailing 5-year and 13-year periods of the S&P 500.
Moreover, the trends of the 10-year Treasury yield also underscore the relevance of short-term fluctuations in the long-term context. Seasonality indicates that yields tend to dip in November and subsequently spike during December. In a year where equity markets have demonstrated a high correlation with interest rates, these patterns reinforce the idea that while November may offer favorable conditions, December could usher in heightened volatility, emphasizing the importance of a dynamic and adaptive investment strategy.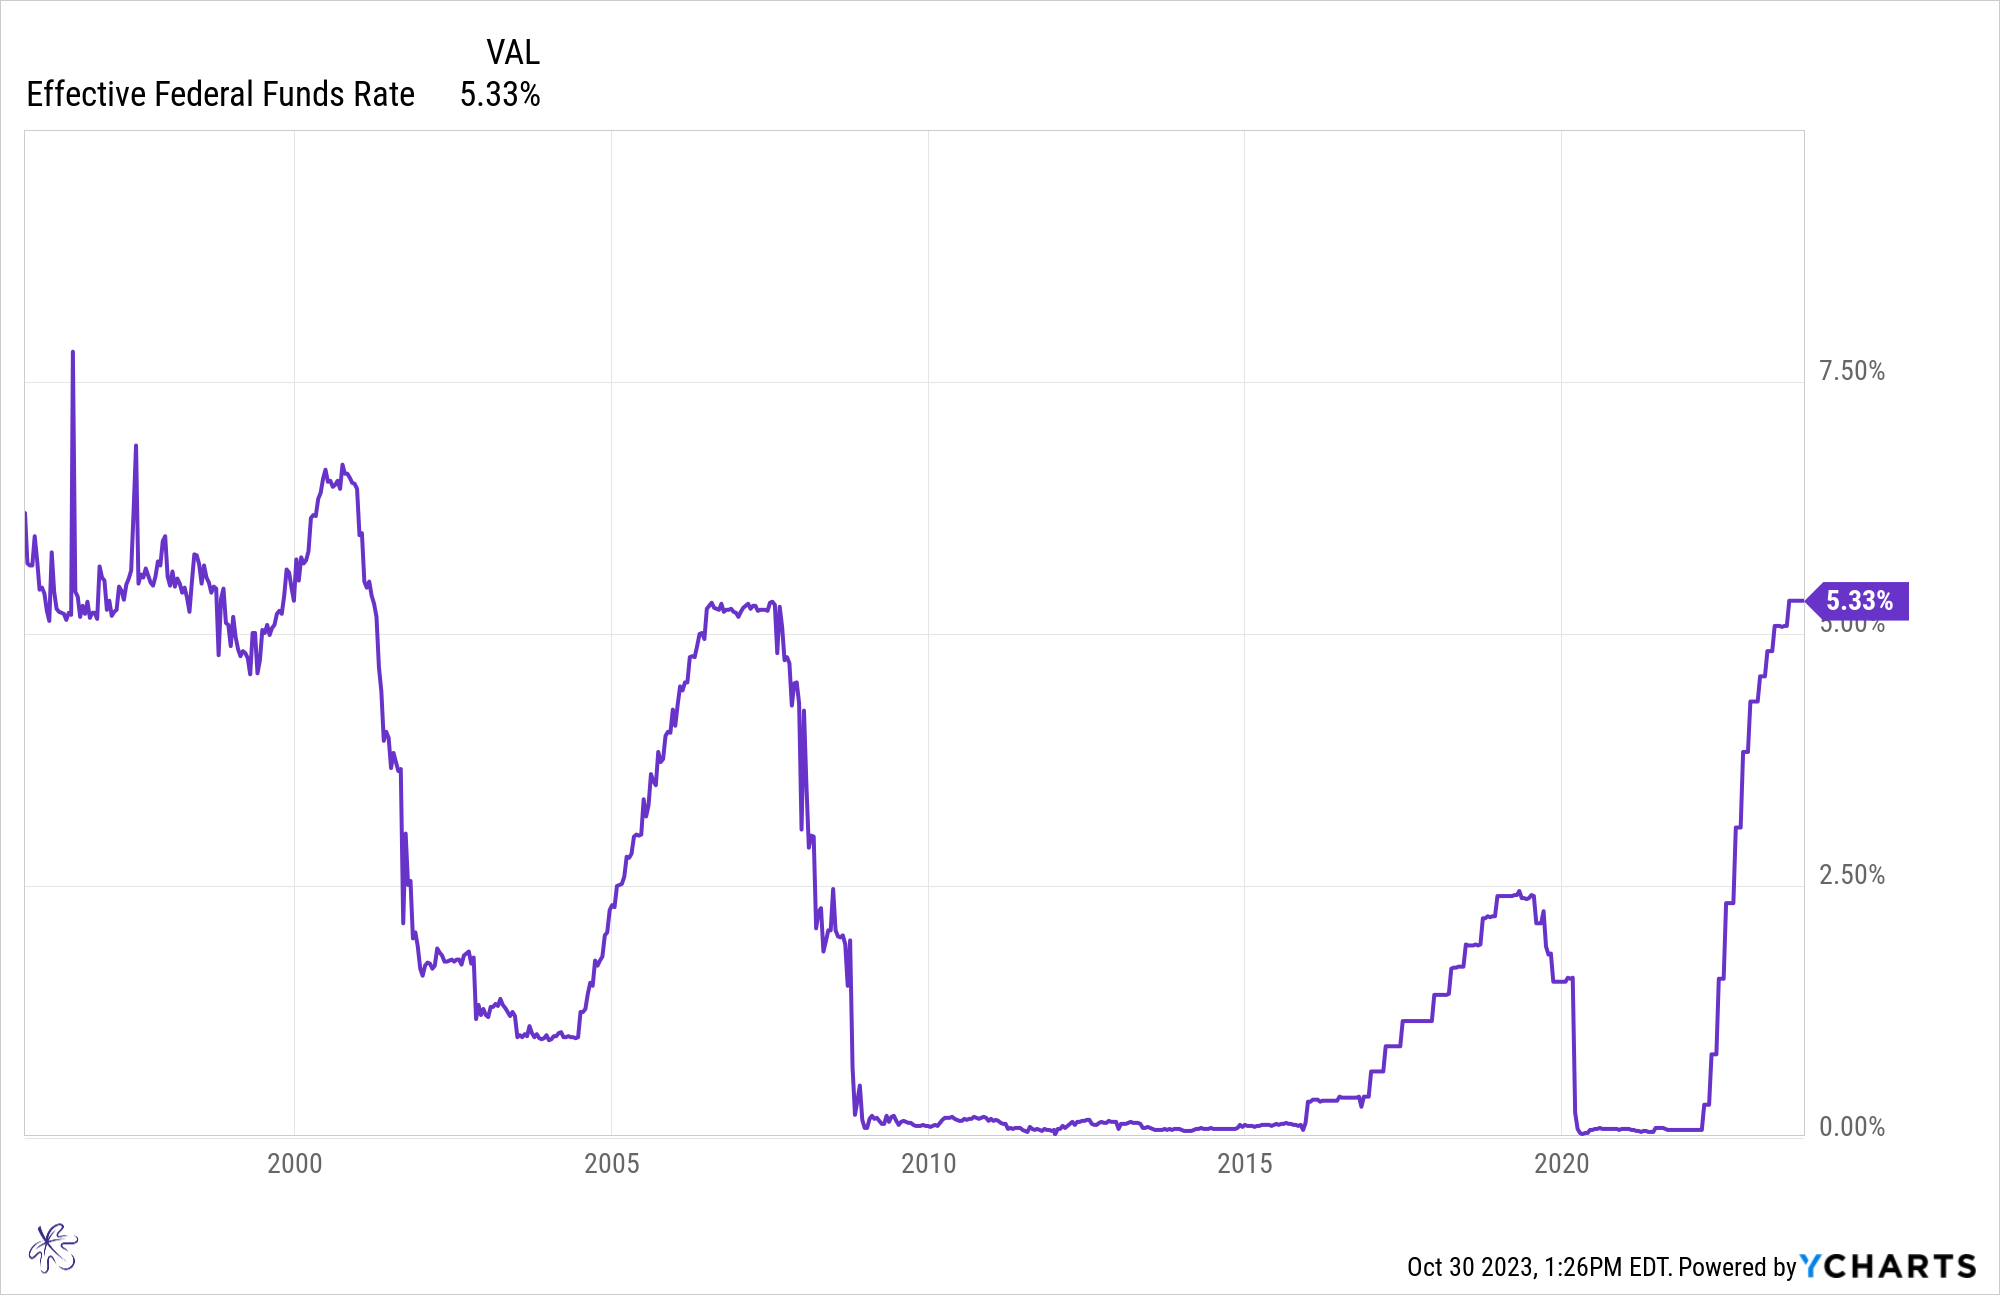
StockCharts.com
Taking a closer look at the seasonality relationships during the most recent rate hike and comparing them to the three prior rate hiking cycles from 1999 through 2000, 2004 through 2007, and 2015 through 2018, we think there is compelling evidence supporting a favorable outlook for November when it comes to the S&P 500 index. In fact, November has shown positive performance in nearly 80% of instances, with an average return of 0.7%.
On the flip side, the relationship with the 10-year Treasury yield does not exhibit as clear a pattern. Rather than a consistent seasonality favoring lower rates, we now see a more mixed picture in terms of rate movements during November. Interestingly, this uncertainty in November is mirrored by a reduced likelihood of 10-year yields moving higher in December, as compared to the patterns observed in the previous two rate hike scenarios. This evolving landscape underscores the need for flexibility and adaptability in navigating the intricacies of today's financial markets.
The intricacies of market seasonality presents a complex landscape where historical patterns coexist with shifting dynamics. While November continues to shine as a favorable month for the S&P 500 index, with a strong track record of positive returns, the 10-year Treasury yield's relationship with seasonality appears less definitive, introducing a degree of uncertainty.
As we reflect on the recent past and draw insights from earlier rate hiking cycles, it becomes evident that the investment landscape is in a state of flux. The traditional playbook of seasonal strategies may need some adjustments in response to changing economic conditions, policy shifts, and market behavior.
Ultimately, this analysis underscores the importance of a well-informed, adaptive investment approach. While seasonality provides valuable insights, it's crucial to complement this knowledge with a comprehensive understanding of current market dynamics and a diversified portfolio tailored to your financial goals and risk tolerance. In today's ever-evolving financial landscape, the ability to adapt and make data-informed decisions remains the key to successful wealth management and investment planning.
