Why ”Happy Birthday to the Bull Market” is a bunch of bull!
Somewhere along the line, people started equating a 20% selloff or rally with an official bull or bear market. Let’s get real: bull and bear markets aren’t defined by a single number.
- Market cycles are more about behavior and investor psychology than arbitrary percentages.
- Technical indicators, like Bollinger Bands, can help identify market trends and cut through the noise.
- Effective risk management is essential, especially for those nearing or in retirement, to protect against large drawdowns.
It’s been painful lately, seeing posts celebrating the “2nd birthday” of the current bull market. These social media “experts” have decided that the October 2022 low marked some new bull run.
Somewhere along the line, people started equating a 20% selloff or rally with an official bull or bear market. Let’s get real: bull and bear markets aren’t defined by a single number. They’re defined by the behavior of investors. Today, I’m here to cut through all the noise to explain what really separates a bull market from a bear market, and to show how corrections fit into the picture.
Using Bollinger Bands for Market Analysis
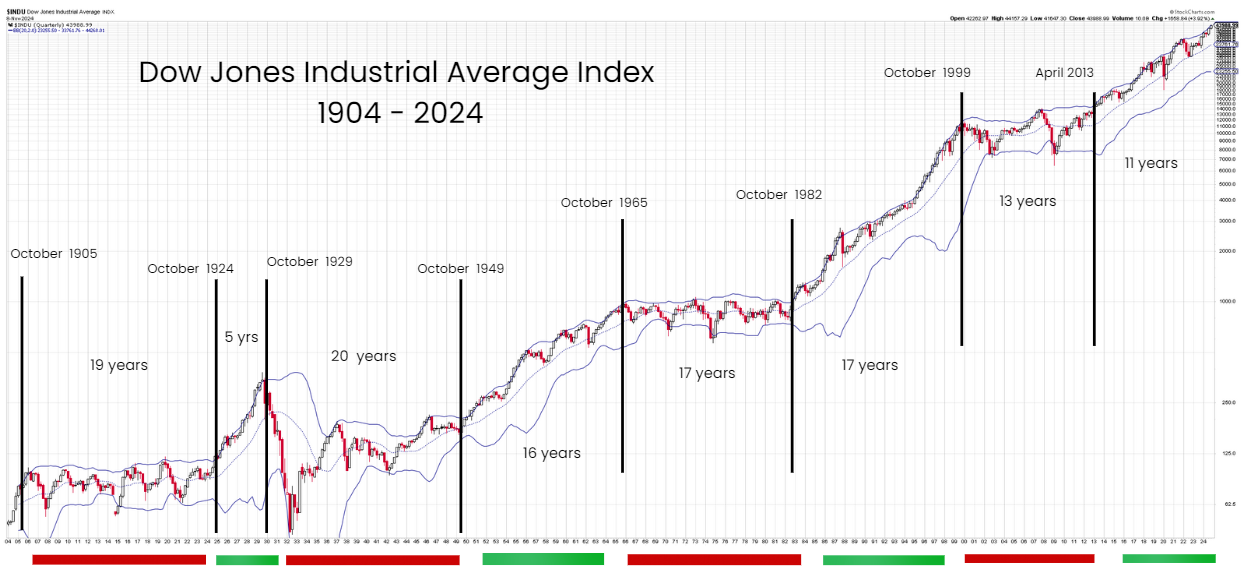
Everyone’s eager to predict what’s going to happen next. Reality check: investing is a lot simpler than all that guessing. I’ve plotted the Dow Jones Industrial Average from 1904 to 2024, representing 120 years of history. This index is one of the only ones that actually goes back that far, making it perfect for this exercise.

Source: StockCharts.com
I’ve used a technical indicator called Bollinger Bands to lay out the upper, middle, and lower bounds of the equity market. Here’s the key: a true bull market is one where the market consistently breaks the upper Bollinger Band while hitting new decade highs. Simple enough? The one exception I’ve made is the period from October 1999 to April 2013, which I still consider a bear market, because, let’s face it, the S&P 500 was mostly flat, and the Nasdaq was in the gutter.
In bull markets, the index rarely dips meaningfully below the middle Bollinger Band, although it might test it.
In bear markets, the index is all over the lower band, often breaking below it. Notice that none of this has anything to do with some arbitrary 20% move; it’s about the actual behavior of the market.
Managing Risk: Corrections and Pullbacks

Source: StockCharts.com
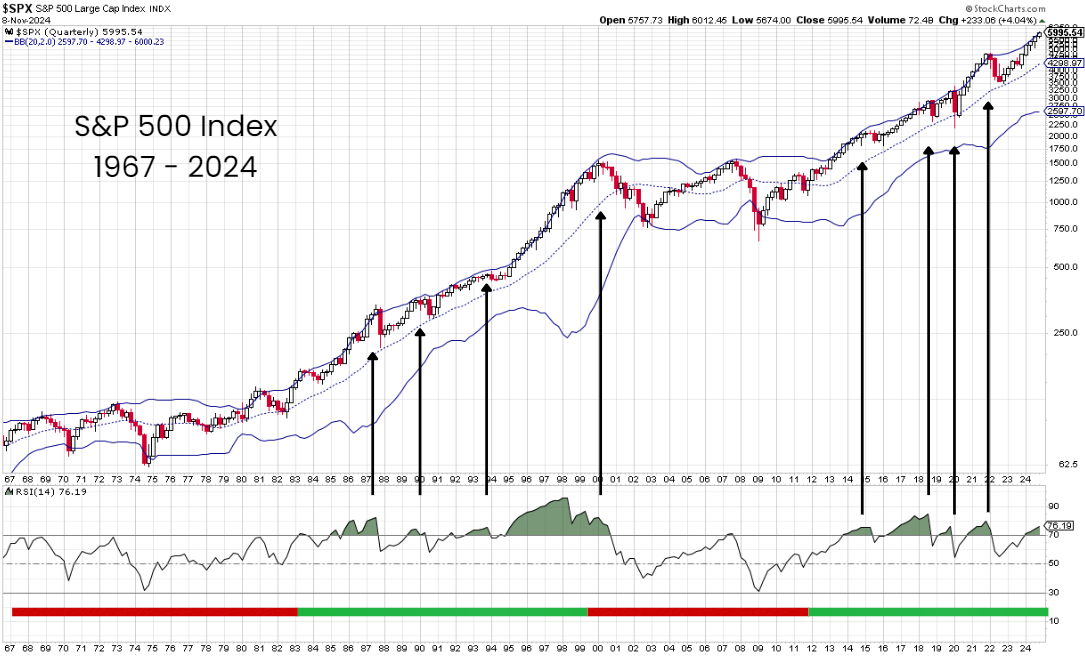
For long-term investors, if the index is above the middle Bollinger Band, sitting tight might be your best bet, no need to let every headline rattle you. Historically, this is one of the few indicators you actually need.
That said, long-term investing often requires a steel stomach. Corrections to the middle Bollinger Band are usually paired with hefty sell-offs. If we look back over previous bull markets and the current one, we see that the S&P 500 has hit an overbought RSI (Relative Strength Index) above 70 four time in the previous bull market. It’s been five times, including now, in the current bull market.
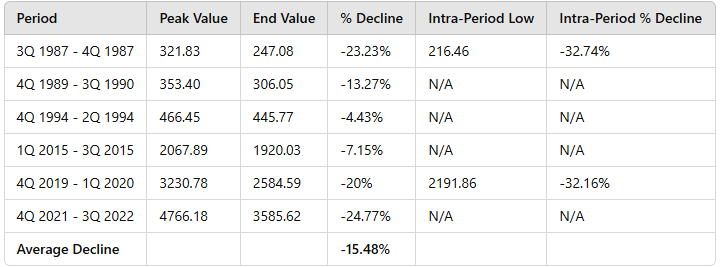
When these overbought conditions happen, the market typically follows with some decent-sized pullbacks. Check out these historical examples:

Source: StockCharts.com, YCharts, TrendSpider, SYKON Capital
The takeaway? During a typical bull market cycle, three corrections of around 15% on average aren’t unusual. If you’re building your portfolio, these are opportunities; if you’re living off it in retirement, it’s time to pay attention because these drawdowns can do serious damage.
Sequence of Returns: Protecting Your Portfolio in Retirement
For retirees, the sequence of returns isn’t a minor detail. If you’re on the brink of retirement and we’re in one of those overbought conditions, caution is warranted. Even if we avoid a bear market, the odds of a correction that puts the middle Bollinger Band in play are high.
Currently, the S&P 500 is at 5995.54. The middle Bollinger Band sits at 4298.97.
If we pull back to this middle band, that’s a 28.30% drop. And that’s just the middle band. In a bear market, hitting the lower band would mean a drop to 2597.70, a whopping 56.67%.
Do the math on your own portfolio. Can you stomach a typical 15.48% loss? How about a 28.30% pullback? Or even a 56.67% drop?
“Everyone has a plan until they get punched in the face.” – Mike Tyson
The Importance of Risk Management in Portfolio Planning
This is why you need to have risk management tools, not just a pep talk to “ride it out.” You need to understand where risks lie and know how to mitigate them. Make sure you’re working with a team that’s got a clear, actionable plan.
Don’t let anyone tell you to just “hang on.” There’s a time to stand firm and a time to act.
Key Takeaways:
- Bull and bear markets aren’t defined by percentages alone—they’re shaped by market behavior and investor psychology.
- The middle Bollinger Band is a valuable tool for long-term investors looking to identify trends and manage risk effectively.
- For retirees or those near retirement, a dynamic risk management approach is crucial to avoid potential capital impairment during downturns.
Market cycles aren’t fairy tales with predictable happy endings. If you’re serious about protecting and growing your portfolio, don’t leave it to chance.
Take control of your financial journey - invest with insight, manage risk effectively, and navigate market cycles with confidence.
