The Charts are Drawing a Line in the Sand
By Todd Stankiewicz | CIO, SYKON Capital | Portfolio Manager, Free Markets ETF (FMKT)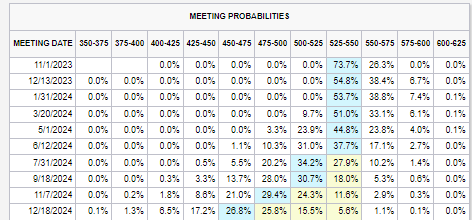
Source: CME Group - FedWatch Tool
The FOMC announced that they would keep rates steady at last weeks meeting. This was widely expected. During the press conference Jerome Powell continues to take a tough stance towards inflation. This message was much tougher than the market was expecting. As a result, market expectations towards the future path of interest rates shifted significantly.
Prior to the meeting, the markets were pricing in a rate cut starting in June of 2024. This base case has now been pushed back to July of 2024. This indicates that the market is expecting the FOMC to remain higher for longer than expected. As a result, the S&P500 index had a hard reversal on the day, dropping from an intraday high of 4461.03 to close almost right at the lows of 4402.20. Over the next two days it continued to move lower, closing the week on the lows at 4320.06.
We spoke about the risk that the market expectations were leaning to heavily on the FOMC easing in our most recent blog post. This base case just adjusted ever so slightly, and the markets sold off 3.16% from the intraday high on Wednesday. Even with Powell remaining consistent in his message, market participants are trying to find ways to read between the lines and find some hidden meaning in what he is saying. When the reality is, don’t overthink it. The FOMC needs to bring inflation down and they do not want to ease off the brakes too early. With energy pricing spiking recently, there is a significant risk that inflation remains persistently stubborn and the Fed will respond appropriately.
Powell also addressed that a soft landing is not the base case scenario. During our September Monthly market update, we went into detail about what conditions we believe need to be met in order [Link to replay] to declare victory on the soft landing. Consistent with the data we discuss along with Powell’s message, we gather that we are a long way from the soft landing scenario playing out.
So then, what is next for the markets. We need to turn to the charts. I want to follow up on many of the charts we addressed in the September 2023 market update [Link], which was held prior to the FOMC meeting last Wednesday.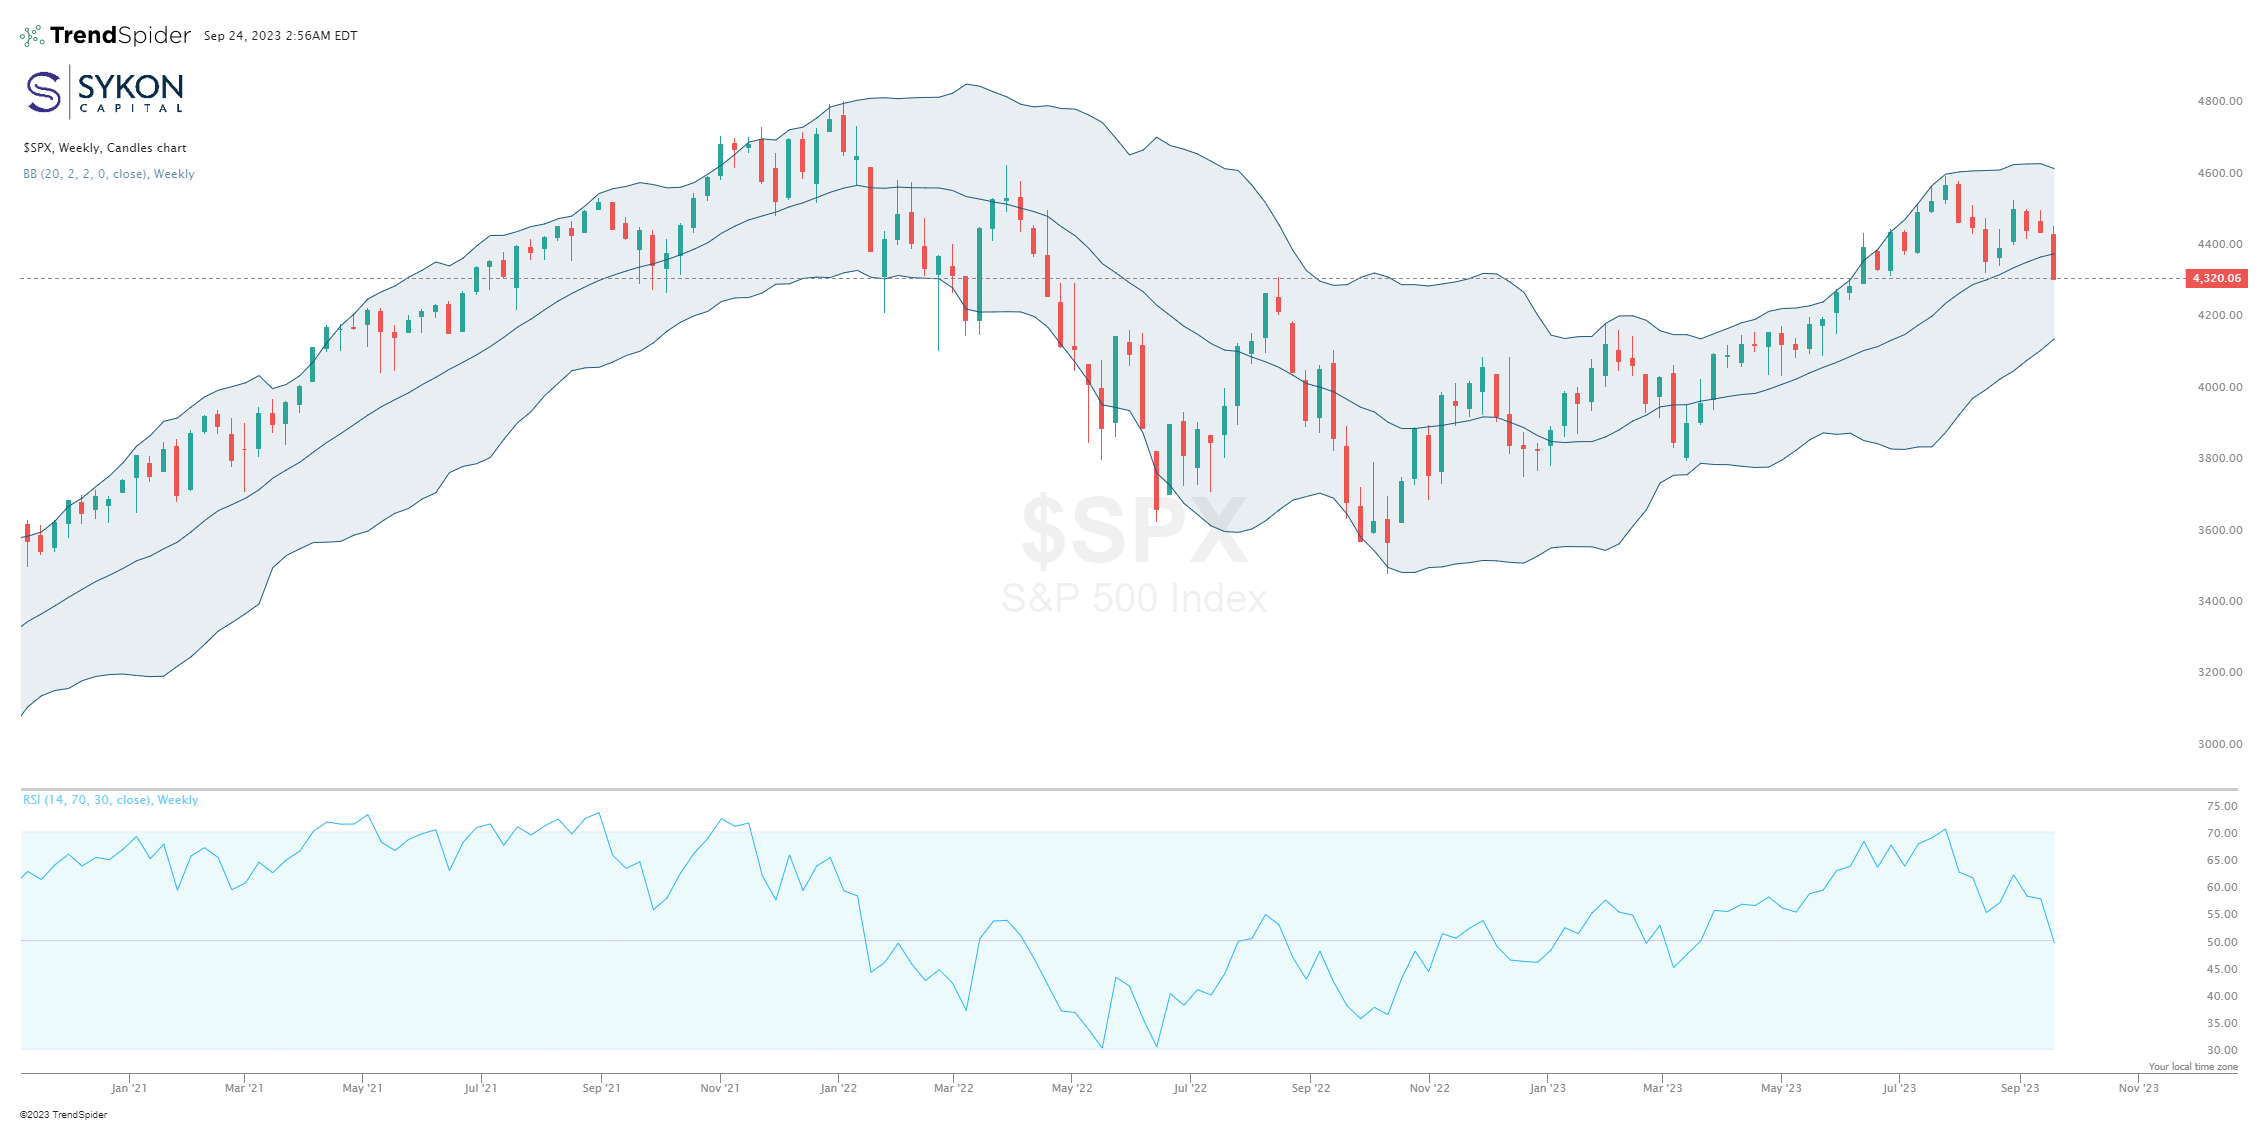
The S&P500 index broke the middle Bollinger Band on the weekly chart with the move lower. This reversal has pushed the RSI indicator down to 49.58. Sitting right on the 50 level. The 50 level is important because it historically marks the point of important trend shifts. There is also key price support coming into play right around this 4320 closing level on the index.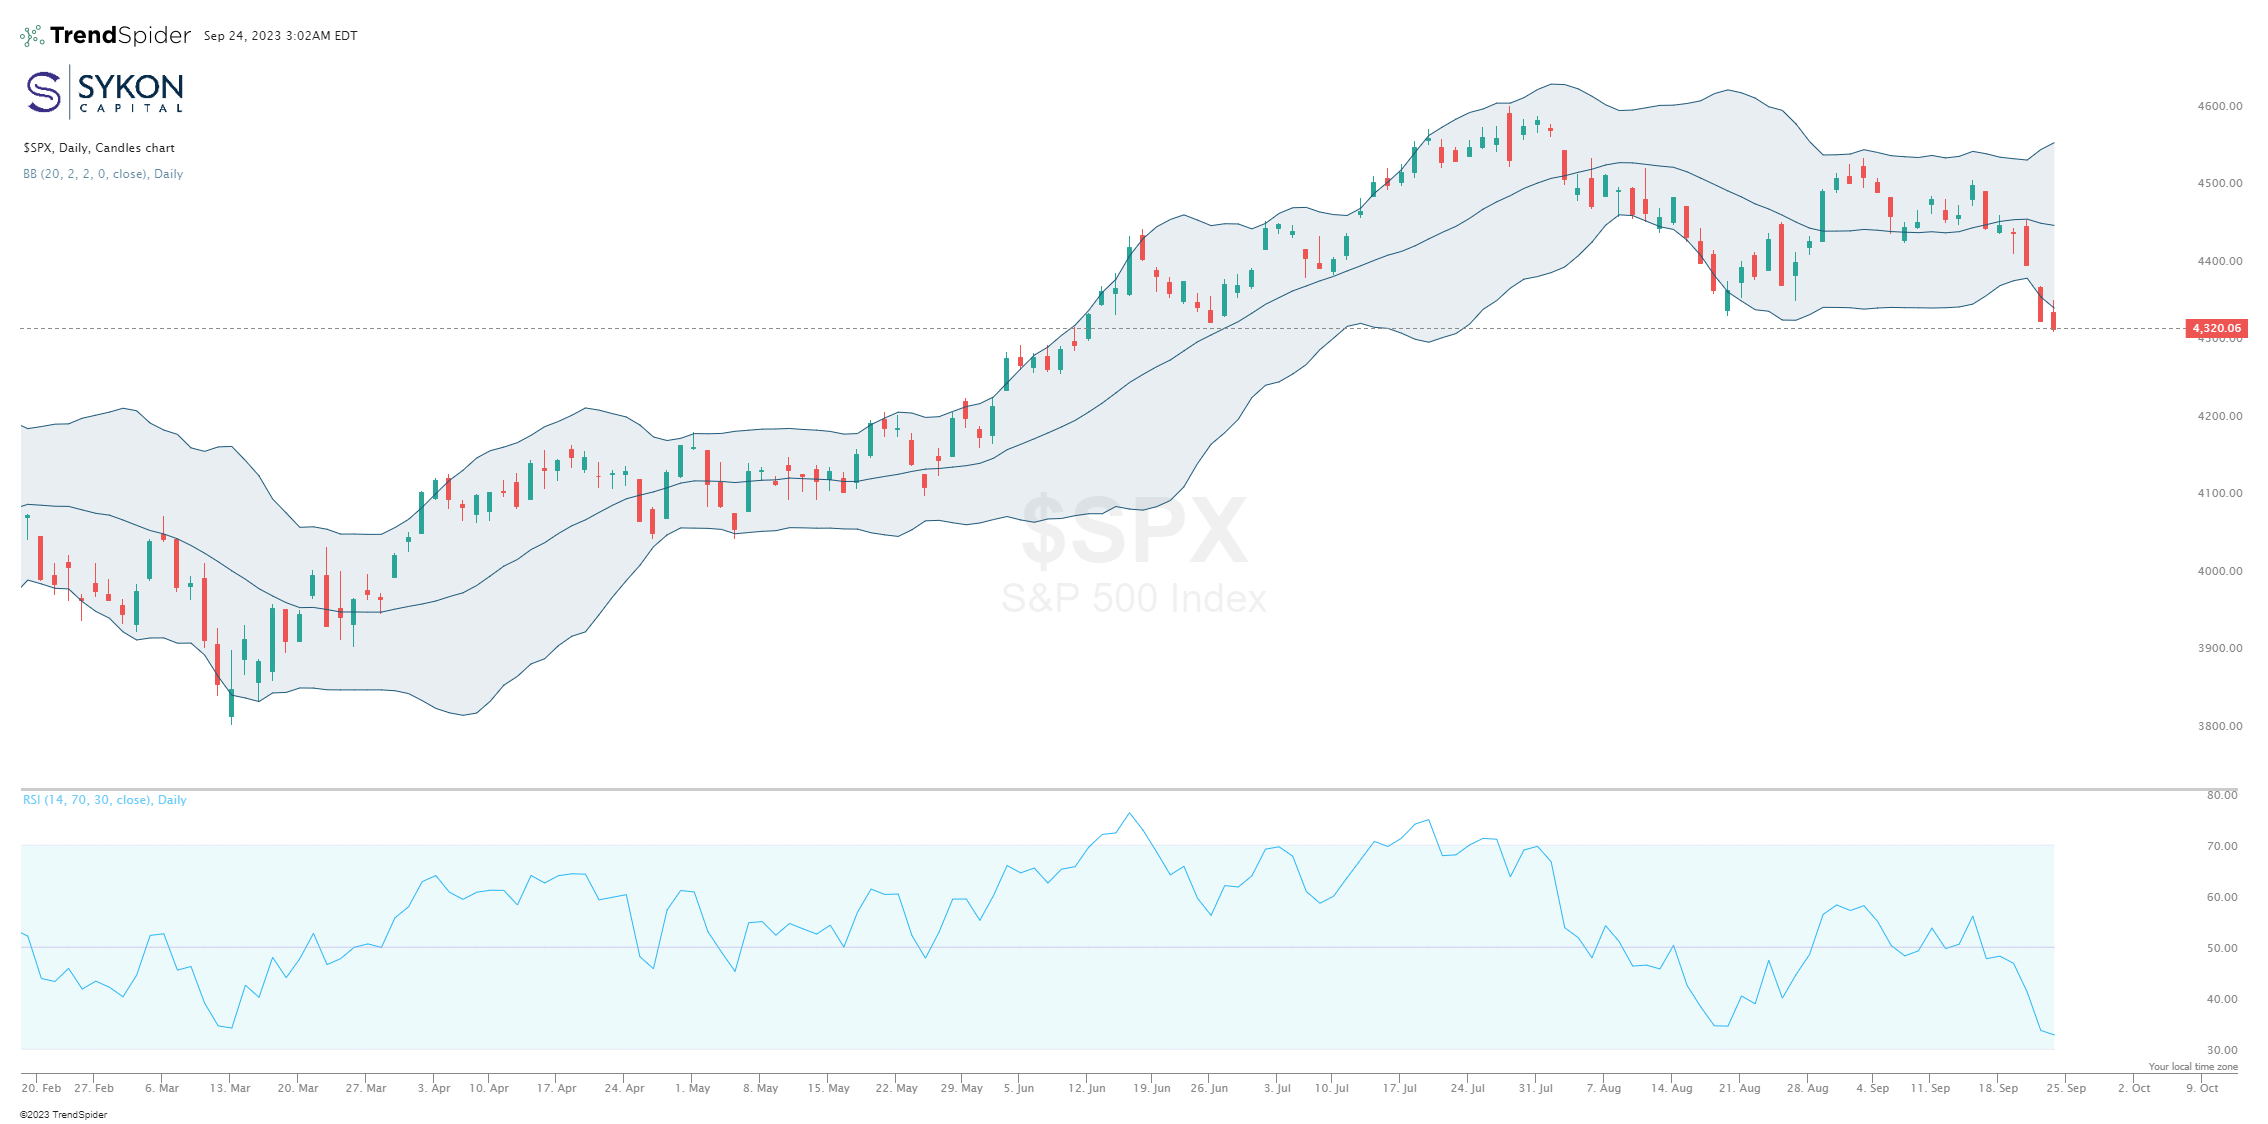
When we zoom into the daily chart of the S&P500, it can be observed that the index breached the lower Bollinger bands, moving into the price support levels that align with the June 2023 index break out. This indicates price action of more than 2 standard deviations. The RSI as of Friday’s close was 32.82. While this is not technically oversold, it would need to drop below 30 for that, it is low. When you consider the breach of the lower Bollinger Band combined with the low RSI reading, one could say that this market move is overextended through the past three days.
Due to the interaction with many important support levels, we need to watch the price action over the next week very closely.
Considering the short-term oversold conditions of the market, we may see a little bounce or at least a pause from the selling in the early part of this week. Given such a move, this should allow the RSI to reset slightly and the price of the S&P500 index to move back inside the lower Bollinger Band. Any pull back or bounce could move back to the middle Bollinger band level of 4389.76 on the weekly chart. We saw similar price action in January of 2022 and then again in August of 2022, December of 2022 and March of 2023.
In January of 2022, the retest ultimately failed. In August of 2022 it also failed resulting in substantial downside price action. In December of 2022, the index retested and eventually broke out above the middle Bollinger Band line to rally. March of 2022 experienced a similar reversal, but it marked the beginning of the bull in 2023.
We do not know what is going to happen going forward, no one does. All we have are probabilities. Over the next week of two, watch the price action of the markets very closely. There is a probability of a bounce based on the short-term oversold conditions. If we get this, the market will need to make a move back above that middle Bollinger Band level around 4389.76. This would put the upper band back in play at 4628.17, but a failure at this middle band could push the index down to the lower band at 4151.34.
It is important to stay very disciplined in times like this. Know your key indicators and have a plan about what actions will be taken based on the data. A disciplined process will be essential to navigating these markets. At SYKON Capital we realize how important this is, it is the reason we utilize an objective, disciplined and dynamic approach to investment management.
