S&P500 Overbought Bear Divergance
By Todd Stankiewicz | CIO, SYKON Capital | Portfolio Manager, Free Markets ETF (FMKT)
With the market making new highs, it appears to have become over extended. What are the probabilities of the next move?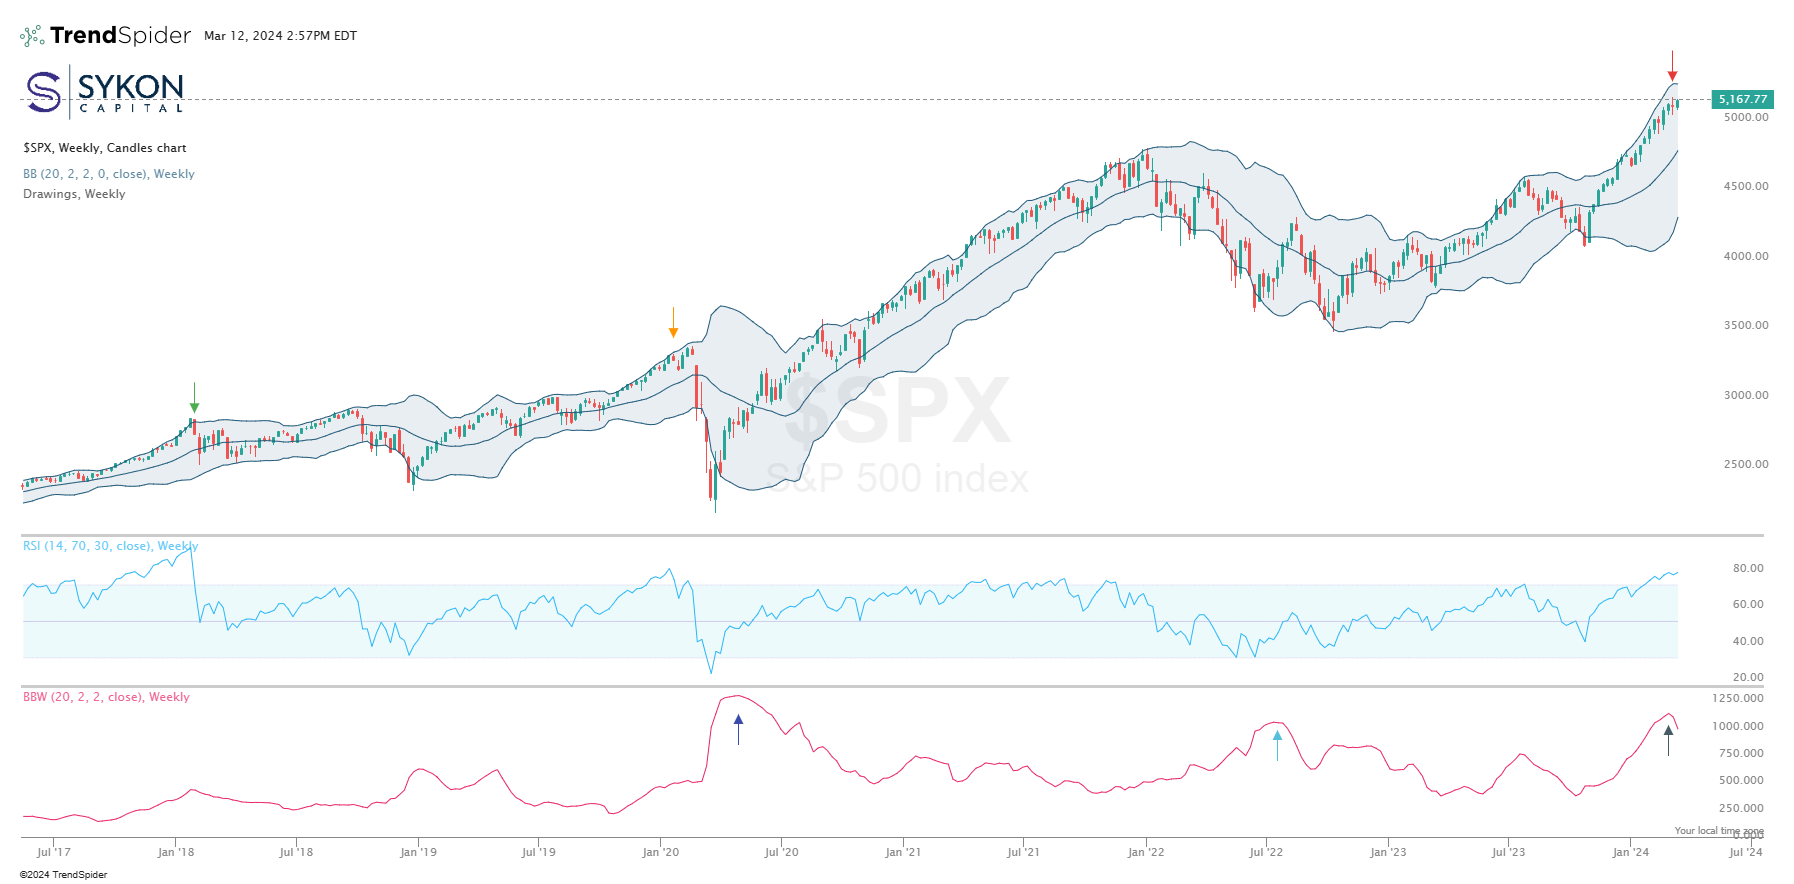
The S&P500 index has reached a weekly RSI reading of 76.81 on March 12, 2024. This is an overbought level that we have only seen 2 other times in the past 7 years. The other times were the week of January 13, 2020 (Orange Arrow) when it reached a level of 79.04 and then January 22, 2018 (Green Arrow) when it peaked at 90.51. Each of these subsequent peaks were followed by meaning declines in the index.
After the January 22, 2018 peak, the index sold off 9.34%.
After the January 13, 2020 peak, the index rose about 2% over the next 4 weeks, but then declined by 30.78% from the RSI peak.
It is important to not rely on only one indicator. So, lets turn to the Bollinger Band (“BB”) width (lower Pink Oscillator). When this indicator is elevated, it means that the market has just made a large move in either the up or down direction. Notice there was a peak in the BB width in April of 2020 during the pandemic sell off. Then there was another peak in June and July of 2022, coinciding with temporary lows in the equity markets.
After each of these BB expansions, there was a rapid reversion trade that caused the BB width to narrow. Today we are experiencing the opposite of those sell offs. We have a rapidly expanding Bollinger Band width due to a rising market. This is the second widest the band have been in the past 7 years. Only the pandemic sell-off exceeded today’s expansion.
As each of these scenarios were accompanied by oversold conditions, today’s expansion is accompanied by RSI overbought conditions.
There is a very high probability that a reversion to the mean move may occur. If history is any guide, it can be rather substantial and quick when is occurs.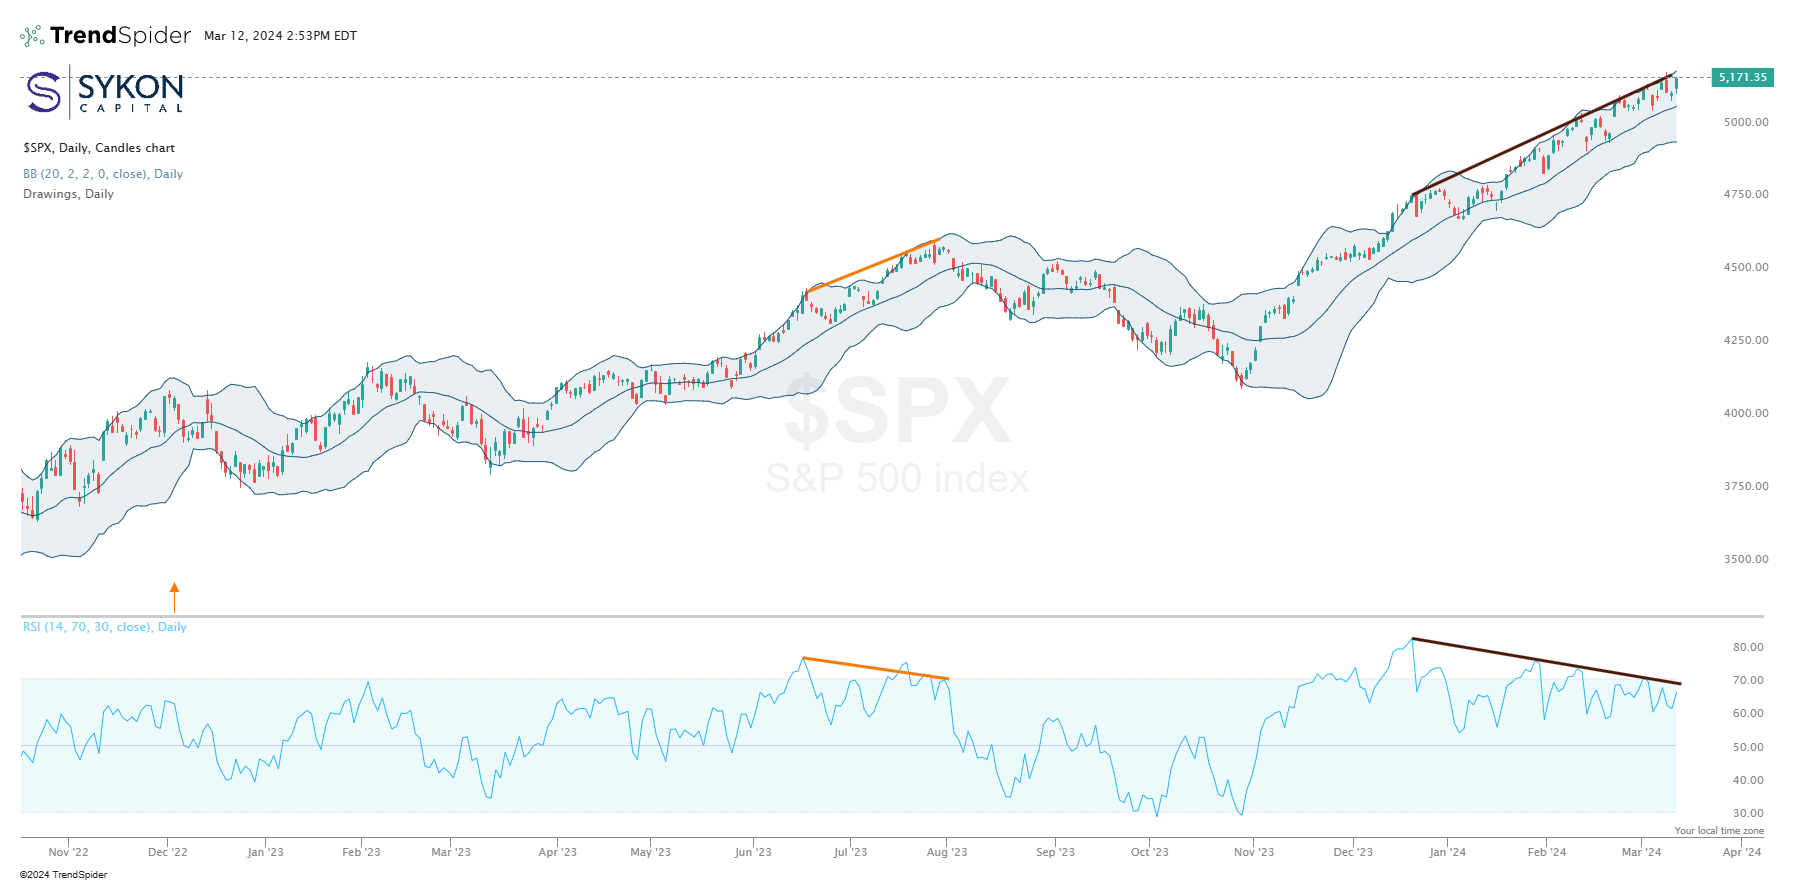
To get a better perspective on the timing of this scenario, we move to a daily chart. The S&P500 index began a rally back in early November. This marked the bottom of the summer sell off that occurred from August through October 2023.
The August sell off was preceded by similar conditions to what we are seeing today. An overbought RSI reading, combined with a bearish RSI divergence. In fact, our blog post on August 1 ("Is this rally exhausted?") highlighted these risks in detail. Then again, our blog post on November 1
("What might seaonsality tell us about the markets?") highlighted the exact opposite, a bullish RSI divergences which increased the probability of a rally in the index.
Once again, we are seeing a pattern of higher highs on the S&P500, but lower highs on the RSI indicator. This is a classic bearish divergence. It will be very important for us to watch the middle Bollinger band level of 5083. Since the break out in November, this line has served as a source of substantial support for the index. It has been tested and held multiple times in January and then again in February.
Back in August, it was the break of the support that saw a substantial increase in market volatility for the next 3 months. A break of this support will put the lower Bollinger band in play at 4967. Moving below this level can mean that there may be more substantial downside risk in the index as there will be a tendency for the index to ride the band lower. These were similar patterns to what was experienced in December of 2022, February of 2023 and then again in August of 2023.
There are some important steps you can take to protect yourself from the risks associated with increased market volatility:
1) Consider rebalancing your portfolio. Given the magnitude of the equity rally, it is possible your equity exposure has increased disproportionately to your other assets. This can mean that the overall level of portfolio risk has increased without you realizing it. Rebalancing the portfolio will help increase the chances that your portfolio is within your intended risk tolerance.
2) Devise and action plan that help manage your downside if the market is to pull back. Understand what level of loss you are comfortable accepting and then stay disciplined to the plan you set. If the market does not continue lower, you can always get back in, but hanging on to declining assets can be a slippery slope.
3) Ensure that your portfolio is utilizing diversifying assets. Assess your overall asset allocation and run a correlation matrix to understand the effective correlation of your assets. If the correlations are consistently over 0.60, you may need to consider find more asset the have correlations closer to 0 or potentially have negative correlations to ensure your asset allocation is balancing risk.
This is not a complete list of actions that can be taken, but is rather some basic steps that can be utilized to help be prepared. I think that it is particularly important to be focused on risk at this level because our longer term, weekly charts are also displaying some of the highest reversion probabilities in the past 7 years.
Have a plan and be discipline. It is tempting to get caught up in the FOMO and try to chase markets.
But bull markets are not what we believe determines the proper asset allocation. Volatile markets do.
Your asset allocation should be a product of how comfortable you are when the market pulls back 5%, 10% or more. It’s not always about what you make, it’s about what you don’t lose.
